Falcon LogScale – Getting Value from Your Proxy Logs
All web traffic flowing out of your company network should be passing through a web proxy. These proxy logs are a great resource for threat hunting and security investigations, yet they often translate into extremely large volumes of data.
In a previous blog post, we shared the value of proxy logs in addressing a range of use cases, including hunting for threats, investigating access to unknown domains and phishing sites, searching for indicators of compromise (IOCs) and meeting compliance requirements. In this blog, we’ll show how you can achieve this with CrowdStrike® Falcon LogScale™, using Zscaler proxy data as an example.
Video
Bringing Proxy Logs into Falcon LogScale
You can use the HTTP API to bring your proxy logs into Falcon LogScale. When working with Zscaler, you can use Zscaler Nanolog Streaming Service (NSS), which comes in two variants:
- Cloud NSS allows you to send logs directly to Falcon LogScale.
- VM-based NSS allows you to collect logs on a VM, where they can be sent to Falcon LogScale via syslog.
Once data is streaming into Falcon LogScale, you can extract the relevant fields during the parsing process. These fields include:
| Destination Host Name | The domain or URL being accessed |
| Destination IP | The IP address being accessed |
| Destination Port | The network port being accessed |
| User Agent | The user agent used to initiate the traffic (Chrome, Mozilla, Curl) |
| Request Method | Was it a GET or POST request? |
| Device Action | Did the proxy allow or deny the requested traffic? |
| Referrer | Who referred the traffic toward the destination host name? |
| Domain/URL Category | What is the domain/URL categorized as? (e.g., malicious or business) |
| Requested File Name | The requested file name when accessing a website |
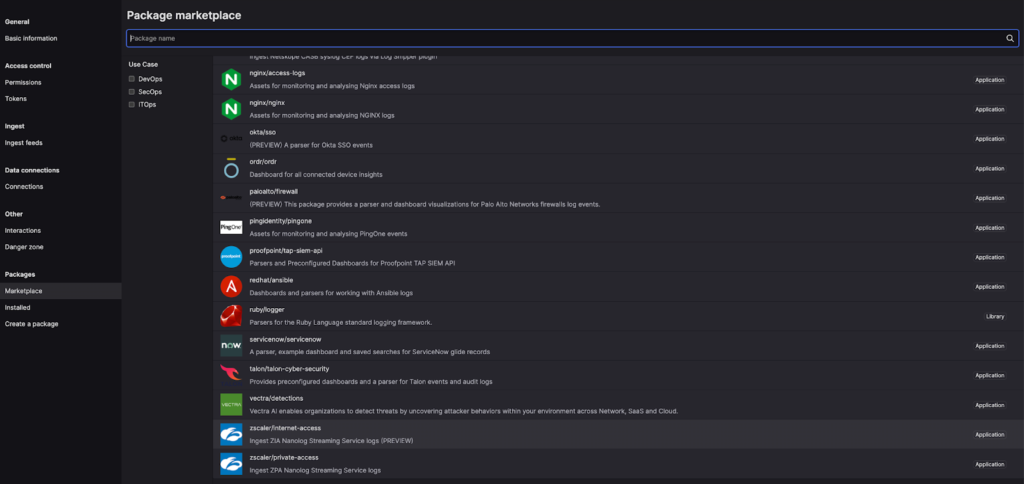
The Zscaler package can be installed from the Falcon LogScale marketplace. It includes parsers for extracting fields from DNS, firewall, web and tunnel logs. It also provides saved queries and out-of-the-box dashboards, which show details such as:
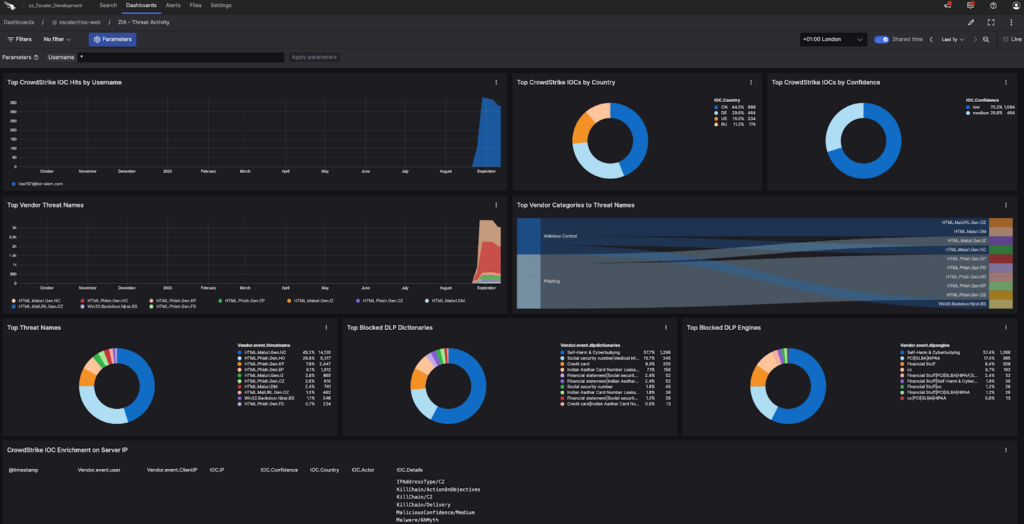
Web: Threat Activity
This dashboard provides high-level threat activity showing a range of widgets, including IOCs, data loss prevention (DLP), vendor-defined threats and enrichment with CrowdStrike threat intelligence.
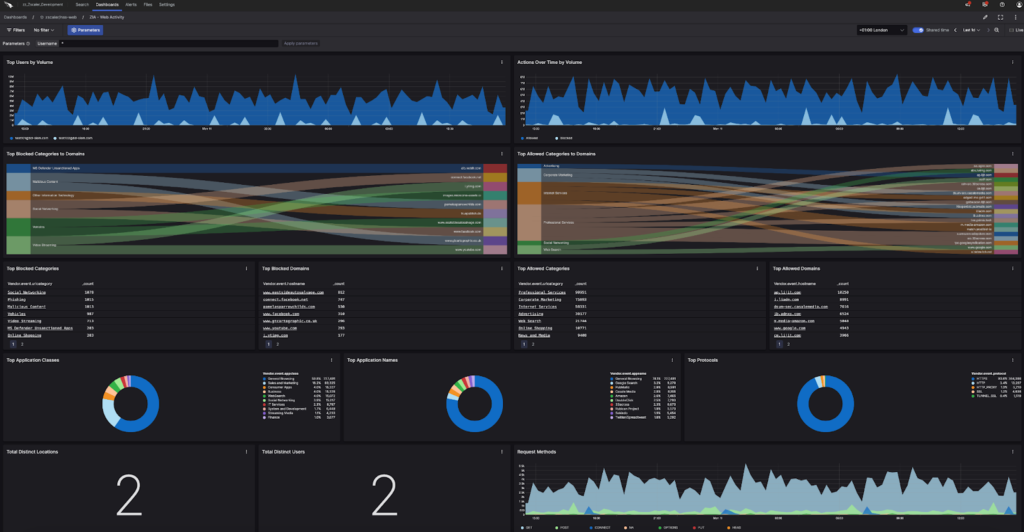
Web: Web Activity
This dashboard provides details about user activity and actions as well as blocked and allowed domain activity, application activity and even information about user agents being used.
Web: User Investigation
This feature allows you to drill down into a specific user’s activity and is a combination of the Threat Activity and Web Activity dashboards.
Threat Hunting Queries with Zscaler Proxy Data
Here are useful searches and queries to hunt for threats across Zscaler proxy data:
Proxy Traffic Summary by User
| groupBy([Vendor.deviceowner, Vendor.devicehostname, Vendor.cip, Vendor.department, event.action, Vendor.hostname] , function=[collect([http.response.status.code,http.request.method,Vendor.proto,Vendor.contenttype,Vendor.appclass,Vendor.appname,Vendor.ereferer,Vendor.eurl,Vendor.urlcat,Vendor.urlclass,Vendor.urlsupercat,Vendor.agent.original]), sum(Vendor.reqsize, as=totalRequestSize), sum(Vendor.respsize, as=totalResponseSize), count(Vendor.url, as=totalHits), min(@timestamp, as=earliest), max(@timestamp, as=latest) ]) | asn(Vendor.cip, as=asn) | formatTime("%Y/%m/%d %H:%M:%S", as=earliest, field=earliest, locale=en_US, timezone=Z) | formatTime("%Y/%m/%d %H:%M:%S", as=latest, field=latest, locale=en_US, timezone=Z)
Proxy Traffic Timeline for a User
| select([@timestamp, #Vendor.action, host.name, http.request.referrer, Vendor.urlcat,Vendor.urlclass,Vendor.urlsupercat,user_agent.original, http.response.status_code,http.request.method,Vendor.proto, Vendor.contenttype, Vendor.eurl])
Abnormal User Agent Strings
user_agent.original=/(?i)(?:bits|WebDAV|PowerShell|Curl|Microsoft)/
Open Redirect
Vendor.eurl=/s?\:\/\/(?:www\.)?t\.(?:[\w\-\.]+\/+)+(?:r|redirect)\/?\?/
Dynamic DNS
Vendor.urlcat = "Dynamic DNS Host"
Top User Agents
| event.action=Allowed| top(Vendor.eua, limit=100)
Top Threat Activity
| Vendor.threatname!="None"| timechart(Vendor.threatname, limit=10)
CloudFront Domain Connection
| event.action=Allowed Vendor.event.hostname=/cloudfront.net/i
Suspicious Web Categories
Vendor.urlcat=/(?i)(?:adware\/spyware\ssites|botnet\scallback|browser\sexploit|shost|malicious\scontent|phishing|remote\saccess\stools|spyware\scallback|spyware\/adware|suspicious\scontent)/| table([Vendor.devicehostname ,Vendor.urlcat, Vendor.eurl, @timestamp])
Unbeatable Scale and Performance
Join leading organizations by augmenting or replacing your security information and event management (SIEM) solution with Falcon LogScale for unbeatable scale and performance. With its unique index-free architecture and advanced compression technology, Falcon LogScale empowers you to stop breaches by delivering high-speed search and sub-second latency for live dashboards and real-time alerting.
With Falcon LogScale, you can cut costs by up to 80% compared to legacy SIEM solutions. Its vast scale and affordable price let you avoid making tough tradeoffs between cost, how much data you can collect and how long you can store it. With Falcon LogScale, you can retain petabytes of data for years.
To learn more about Falcon LogScale integrations, visit the Integrations page. To find out if Falcon LogScale can help you fulfill your SIEM and logging requirements, contact a CrowdStrike expert today.
Additional Resources
- View Zscaler and Broadcom ProxySG integration instructions.
- Download the CrowdStrike eBook, 8 Things Your Next SIEM Must Do, to understand the critical capabilities to look for when evaluating SIEM solutions.
- See Falcon LogScale in action by watching a fast-paced demo.
- Sharpen your threat hunting skills with Falcon LogScale by attending a hands-on lab.
- Find out how to log everything to answer anything in real time by visiting the Falcon LogScale product page.

