Apache Kafka is an open-source event streaming platform that treats data as events and stores them as an ordered sequence of records in a distributed, fault-tolerant manner. With today’s applications constantly relying on dynamic information to achieve their tasks, Kafka enables your application services and users to access data seamlessly with little to no latency.
This article is part one of a series on Kafka logging. In part one, we will cover the basics. We will provide a brief overview of Kafka, its architecture and its main components. Then, we will cover the key commands used to manipulate messages and track how data flows within the Kafka ecosystem.
Learn More
Explore the complete Kafka Logging Guide series:
- Part 1: The Basics
- Part 2: Advanced Concepts
- Part 3: Managing Performance Logs
- Part 4: Securing Kafka Logs
Overview of Kafka Architecture
Kafka stores messages in an ordered data structure called logs. These are not like the traditional logs you might be familiar with. Instead, Kafka logs are named structures that hold records in an immutable manner, distributed across servers. These named structures are called Topics. The logs are replicated across every node in the Kafka cluster and partitioned so that consumers can subscribe accordingly and have data available to them at all times.

Kafka Components
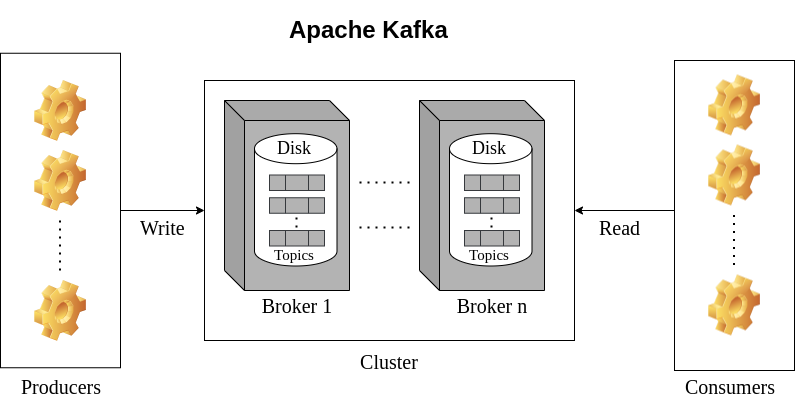
In the diagram above, you can observe all the main components that make up the Kafka ecosystem in a single cluster environment.
Brokers
A broker is a single node with a storage disk, responsible for saving records in the correct order and exposing the data to be accessible by services. The brokers are also called Kafka servers, and they don’t have a state of their own.
Producers
Producers are entities that send events to the Kafka servers. They could be any application, service or third-party tool interacting with the Kafka cluster using the producer API.
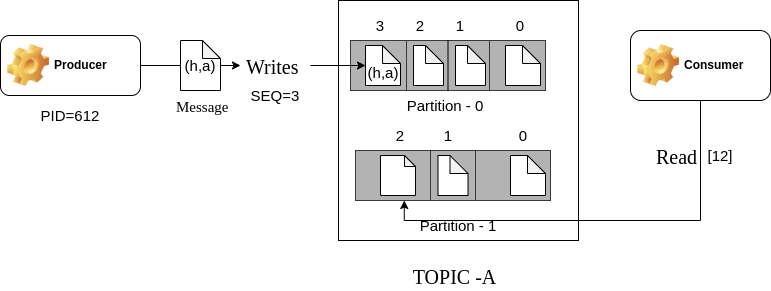
When a producer is initialized to interact with the server, it’s assigned a unique identifier called Producer Id (PID). The PID is a unique counter variable that starts at 0 and increments whenever a message is published. This is a handy property that resolves duplication issues occurring in the data.
Consumers
Consumers are entities that fetch event logs from the Kafka servers by supplying the correct key using the consumer API.
Topics
The records received at the Kafka node are placed in an ordered, append-only queue.

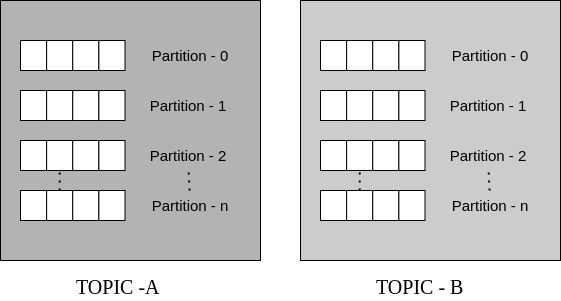
In real business applications, there are many processes and services accessing records continuously, which can lead to issues like slow performance when dealing with append-only queues. To mitigate this, Kafka allows you to create multiple logs for different use cases to group similar data by assigning unique identifiers to each log. These named logs are called Topics.

The logs in each Kafka topic are partitioned to allow more than one consumer to subscribe to a log. This way, Kafka only sends records to those who have subscribed to a particular topic. To fetch a particular record, you provide a key, which is the combination of the offsets of the partition and the record for the particular topic.
Consider the following example:

The producer with an Id of 612 sends a record (h,a) to the first partition using a sequence counter with a value of 3. The broker then combines the Producer Id with the sequence number to write to the partitioned topic.
The consumer fetches the record from the second partition using the key [12]. The first element is the partition number, and the second character is the offset of the message to be read.
Using this, Kafka achieves atomicity in its distributed architecture.
Working with Kafka Logs
Data Relevance
As you can see, Kafka is continuously appending data to its logs. It would be tedious for developers and testers to scroll through all the records to trace particular information, such as a bug or debug messages. To keep your topics as clean as possible, you need strong control over what information needs to be published or ignored.
Consider the log file of a service below:
178.62.253.136 - - [10/Sep/2022:22:53:52 +0800] "Server 01 is ready to peer"178.62.253.136 - - [10/Sep/2022:22:53:52 +0800] "Server 01 is ready to peer"
134.122.184.26 - - [10/Sep/2022:23:02:28 +0800] "Server 05 is ready to peer "-" "<title>(.*?)</title>"
172.104.229.176 - - [10/Sep/2022:23:05:41 +0800] "Server 01 is ready to peer94 "-" "Mozilla/5.0 (X11; Linux x86_64) AppleWebKit/537.36 (KHTML, like Gecko) Chrome/87.0.4280.88 Safari/537.36"
70.35.198.178 - - [10/Sep/2022:23:21:22 +0800] "Server 01 is ready to peer.4322)"
104.248.51.8 - - [10/Sep/2022:23:27:41 +0800] "Server 02 is ready to peer Firefox/79.0"
46.19.141.122 - - [10/Sep/2022:23:37:03 +0800] "Server 01 is ready to peer Firefox/77.0"
74.208.182.71 - - [10/Sep/2022:23:54:47 +0800] "Server 01 connected "-" "Mozilla/5.0 (compatible; bingbot/2.0; +http://www.bing.com/bingbot.htm)"
179.60.150.88 - - [10/Sep/2022:23:56:36 +0800] "x03x00x00/*\x00Cookie: mstshash=Administr" 400 182 "-" "-"
88.208.199.38 - - [11/Sep/2022:00:01:16 +0800] "Server 01 disconnected Firefox/63.0"
192.241.220.53 - - [11/Sep/2022:00:10:01 +0800] "Server 01 is ready to peer" 400 280 "-" "Mozilla/5.0 zgrab/0.x"
The messages “Server 01 is ready to peer” might be irrelevant in application logs and not need to be stored in the Kafka topics.
Retention Policies
Due to the continuous flow of records from multiple producers, Kafka logs will continue to grow in size. Within a short period, the logs will eat up disk space, and storing new messages will be troublesome unless you increase the storage capacity
Of course, this is not very cost-efficient. As time passes, older data becomes less important, and you just want to get rid of it. For this, Kafka provides retention policies, such as a time-based policy that retains logs for certain periods of time (168 hours, by default).
Enabling Logs
Kafka uses the Log4j 2 logging service, which has eight logging levels, each designed to handle different use cases. To enable logging, simply update the Log4j properties.
log4j.rootLogger=Trace, kafkalog4j.appender.kafka=com.cloudera.kafka.log4jappender.KafkaLog4jAppender
log4j.appender.stdout=org.apache.log4j.ConsoleAppender
log4j.appender.stdout.Target=System.out
Kafka Commands to Manipulate Records
Kafka provides many commands to manipulate the cluster through different APIs and interfaces. To start with Kafka logs, let’s cover the key commands you might use.
Create a Kafka Topic
To create a Kafka topic, you would call the Kafka topic API on the server where Kafka is installed. In addition to using the --create flag command, you would include the following parameters:
--topic NAMEto specify the name of the topic--partition NUMBERto specify the number of partitions--replication NUMBERto specify the number of copies Kafka should maintain--bootstrap-server ADDRESSto specify the node address used for initially connecting to the Kafka cluster
The following command creates a topic called ls-topic, with two partitions and two replicas of each partition, initially connecting to the server listening at port 9062 on localhost.
sh kafka-topics.sh --create --topic ls-topic --partitions 2 --replication-factor 2 --bootstrap-server localhost:9062
List all Kafka Topics
To list all Kafka topics, you would use the --listcommand and specify the Kafka cluster connection address using --bootstrap-server. You can also hide internal topics created by Kafka by using --exclude-internal.
sh kafka-topics.sh --list --exclude-internal --bootstrap-server localhost:9062
Delete a Kafka Topic
To delete a Kafka topic, you use the --deleteflag.
sh kafka-topics.sh --delete --topic ls-topic --bootstrap-server localhost:9062
Read all records from a Kafka Topic
To read all messages from a particular Kafka topic, specify the --from-beginningflag parameter with the consumer API.
sh kafka-console-consumer.sh --topic ls-topic --from-beginning --bootstrap-server localhost:9062
Publish to a Kafka Topic
To publish a record to a Kafka topic, you would use the producer API, specifying the --topicand the --bootstrap-server, along with the record to be published.
sh kafka-console-producer.sh --topic ls-topic --bootstrap-server localhost:9062 < “hello logscale”
Log your data with CrowdStrike Falcon Next-Gen SIEM
Elevate your cybersecurity with the CrowdStrike Falcon® platform, the premier AI-native platform for SIEM and log management. Experience security logging at a petabyte scale, choosing between cloud-native or self-hosted deployment options. Log your data with a powerful, index-free architecture, without bottlenecks, allowing threat hunting with over 1 PB of data ingestion per day. Ensure real-time search capabilities to outpace adversaries, achieving sub-second latency for complex queries. Benefit from 360-degree visibility, consolidating data to break down silos and enabling security, IT, and DevOps teams to hunt threats, monitor performance, and ensure compliance seamlessly across 3 billion events in less than 1 second.


