Endpoint Security – Customized Dashboards

Introduction
Security teams today work together to identify and defend against the massive number of cyberthreats out in the world today.
Manually sifting through all that data may be overwhelming, but by streamlining the views to present meaningful information for each role, it enables increased efficiency and simplifies tasks.
CrowdStrike provides fully customizable dashboards to ensure that the various roles on the security teams are provided with the information that they need.
The dashboards go beyond just allowing static prebuilt widgets that can be moved around on a page, but provide customizable data views that enable each individual widget to be tailored for the analyst.
This ensures that each team member can see relevant information quickly and minimizes the time required to remediate any issues identified.
Let’s take a look at how dashboards can help the different roles of the security team.
Walkthrough
IT administrators always like to have an eye on the status of the CrowdStrike Falcon Sensors within the environment. This enables them to understand if there are any gaps and allows them to remediate any issues.
When we Create this dashboard for IT administrators, we’ll create it with data from multiple sources.
On the left, we can add widgets from multiple categories to help administrators understand the state of the environment.
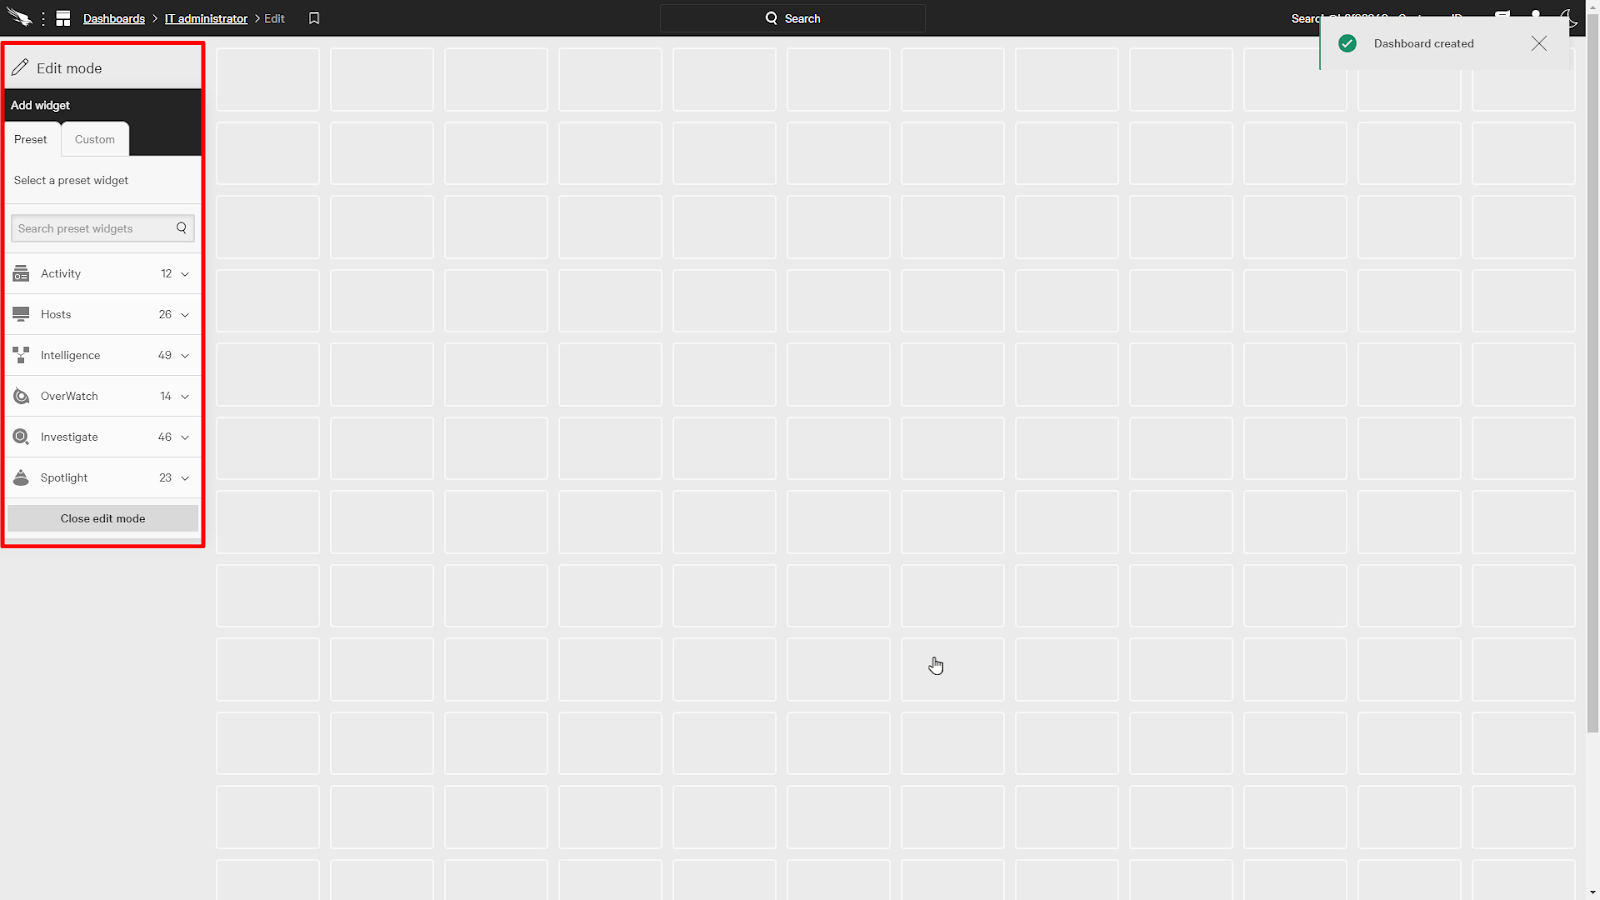
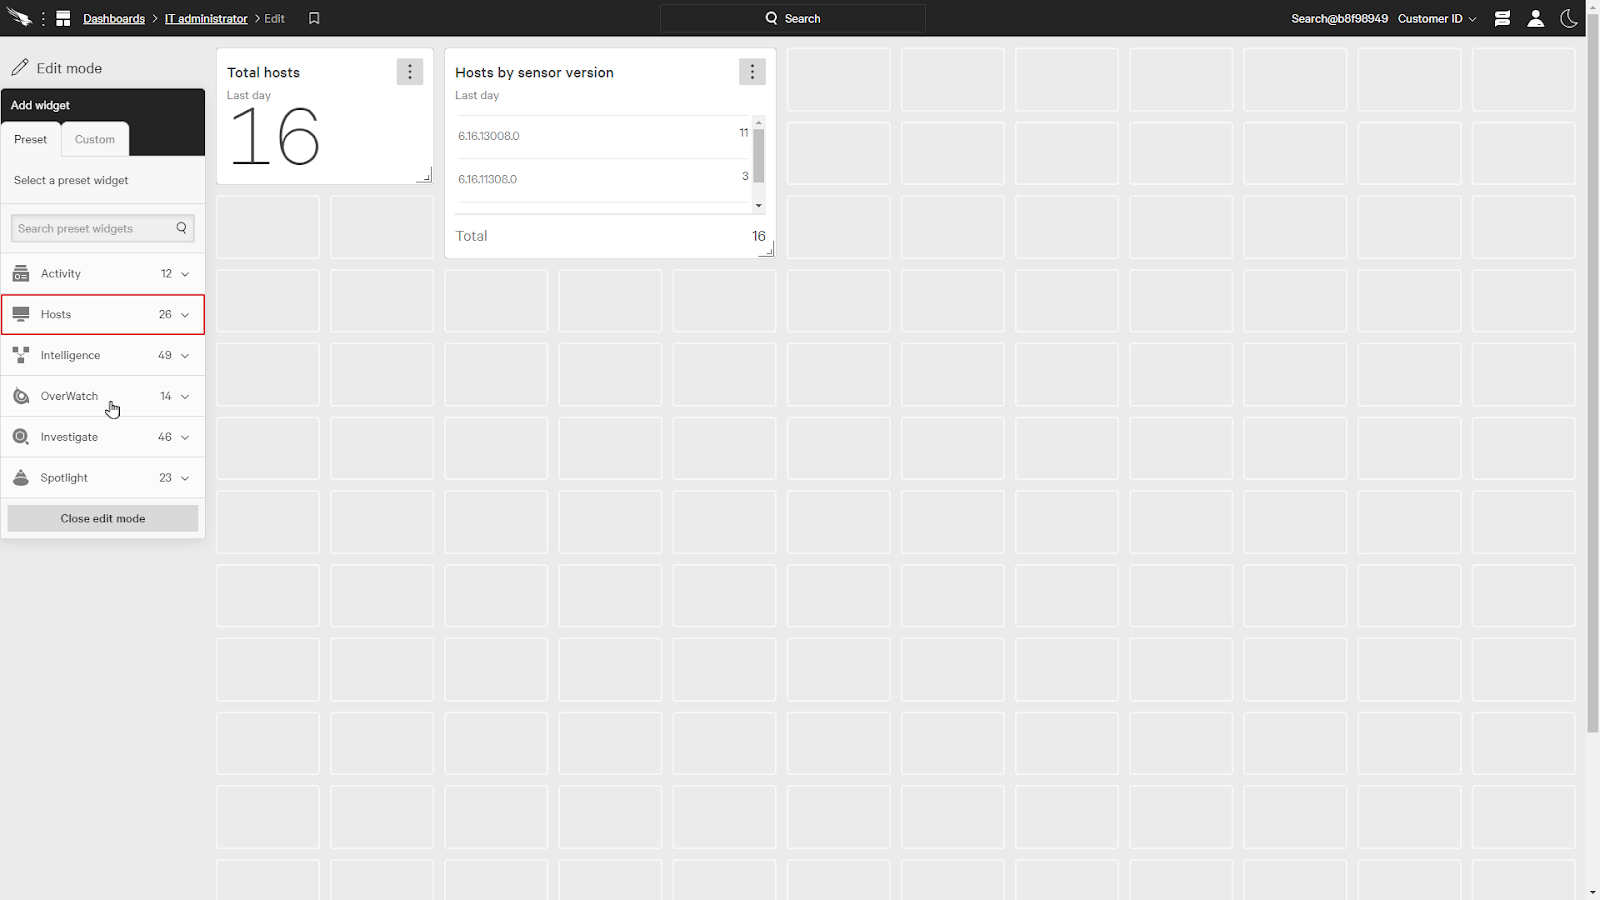
In this example, we’ll start by adding a couple of widgets from the Hosts category.
We’ll add Total Hosts and Hosts by sensor version.
Looking further down, we can expand the Investigate category and add a few more widgets, such as Active Sensors, sensors inactive for more than 14 days, and Linux sensors in RFM.
We can also resize the widgets to show more information and fit on the page as you like.
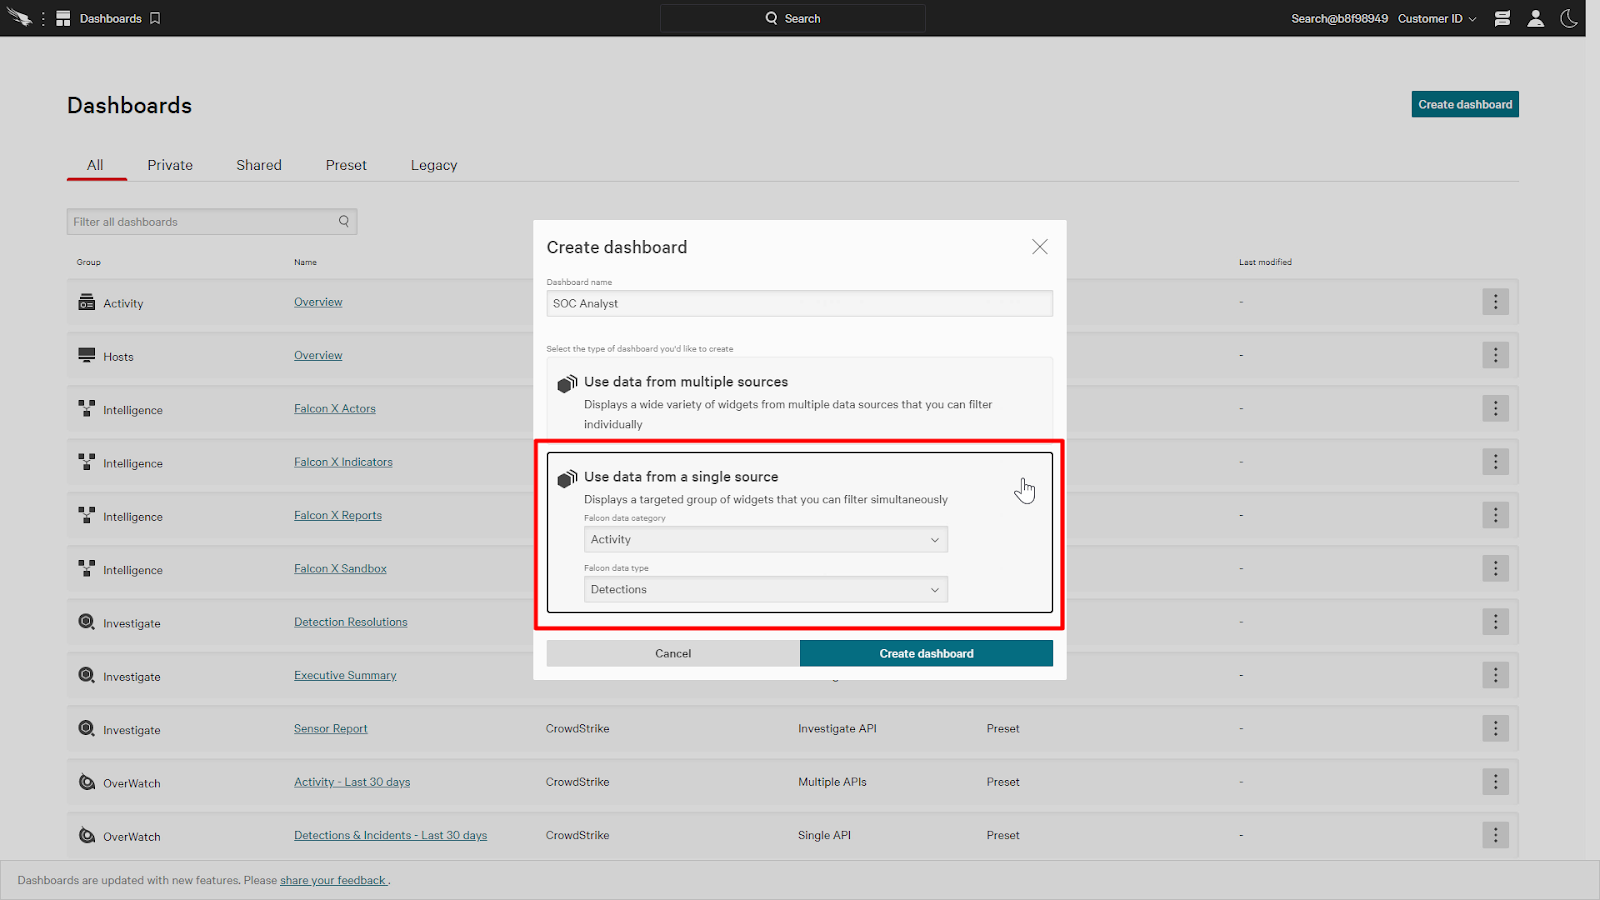
Next, let’s take a look at a dashboard for SOC Analysts. An analyst would like to easily see any security threats detected or blocked.
For this dashboard, we’ll use data from a single source and the category will be activity and the data type will be detections.
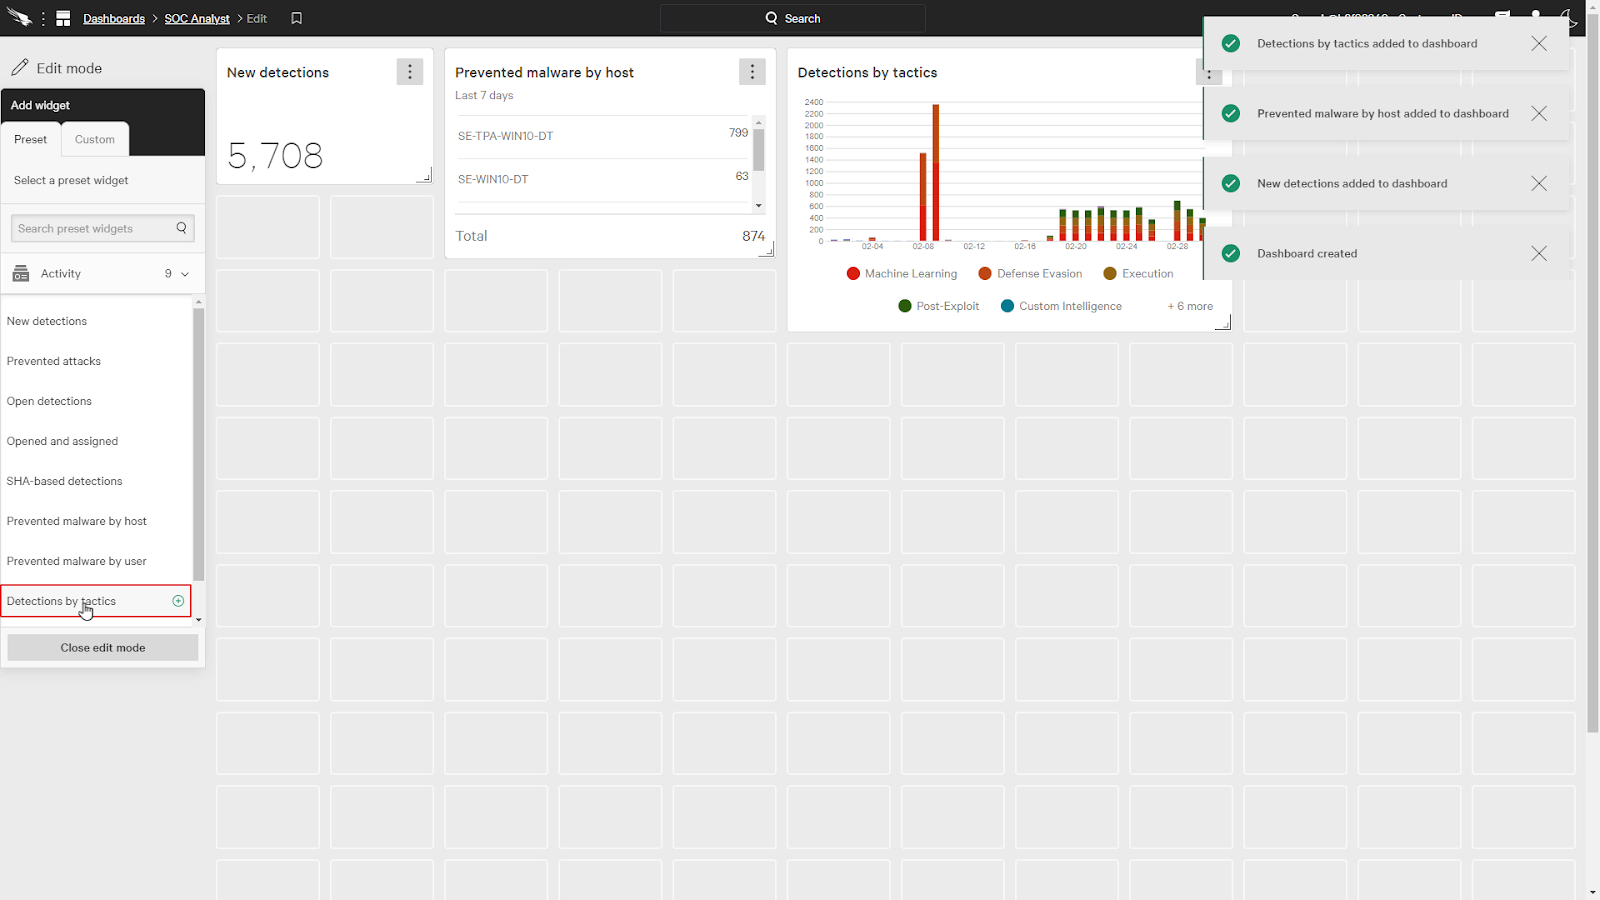
With this single source dashboard, we can add widgets from the Activity category.
Let’s add New detections, Prevented malware by host, and detections by tactics.
We can also add a customized widget as well.
Under Widget appearance, we’ll select Line Chart and the display data is Objective.
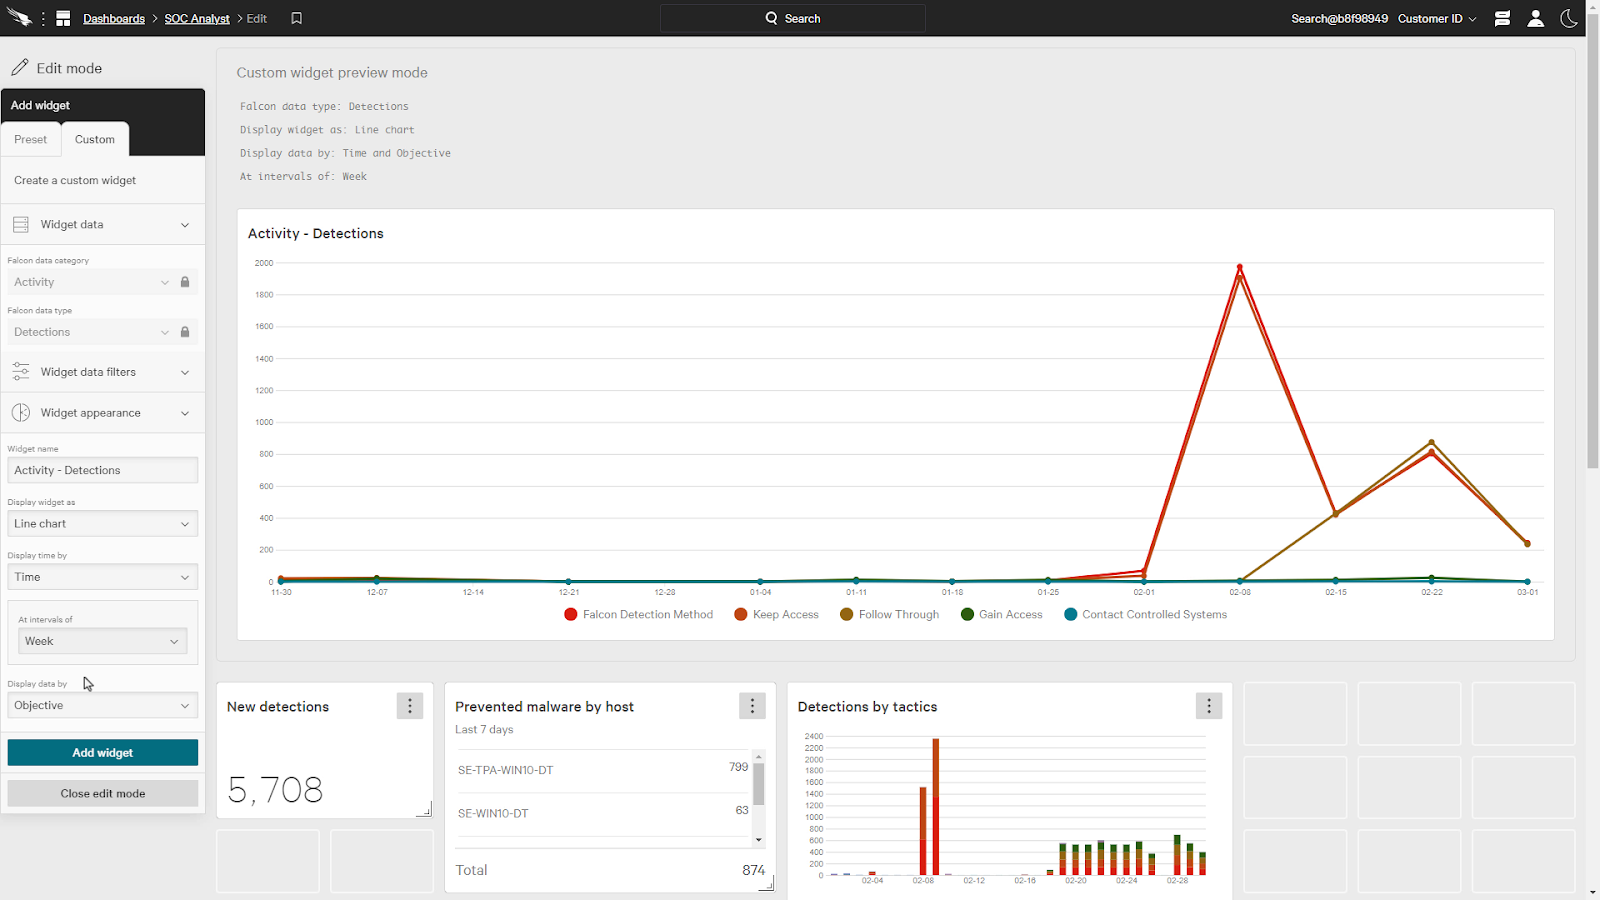
This gives us a chart that shows the objectives of the attack over time which allows the analyst to see any attack trends or if there is a rise in a certain adversary objective.
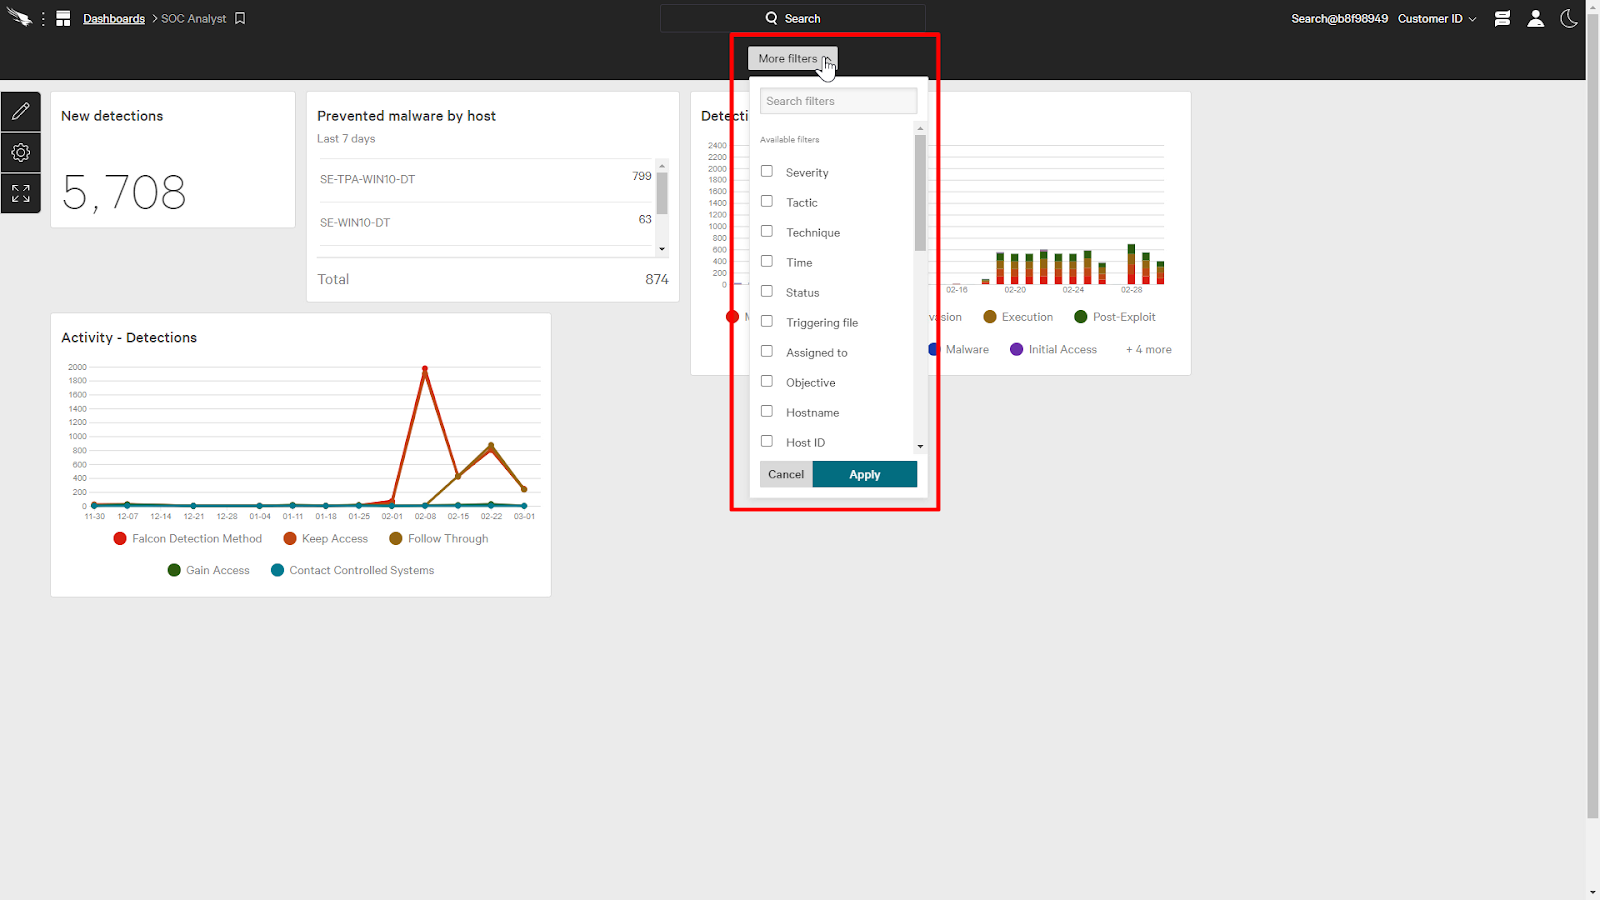
Since this dashboard was a single source dashboard, it provides a filter to dynamically adjust the data to fit our criteria as we hunt for threats.
For example, I can add a filter for the Severity and the time to this dashboard.
Then, we can just filter the data to only display systems with critical and high severity detections in the past month.
This will help us focus on the most important detections in a time frame that we can act upon.
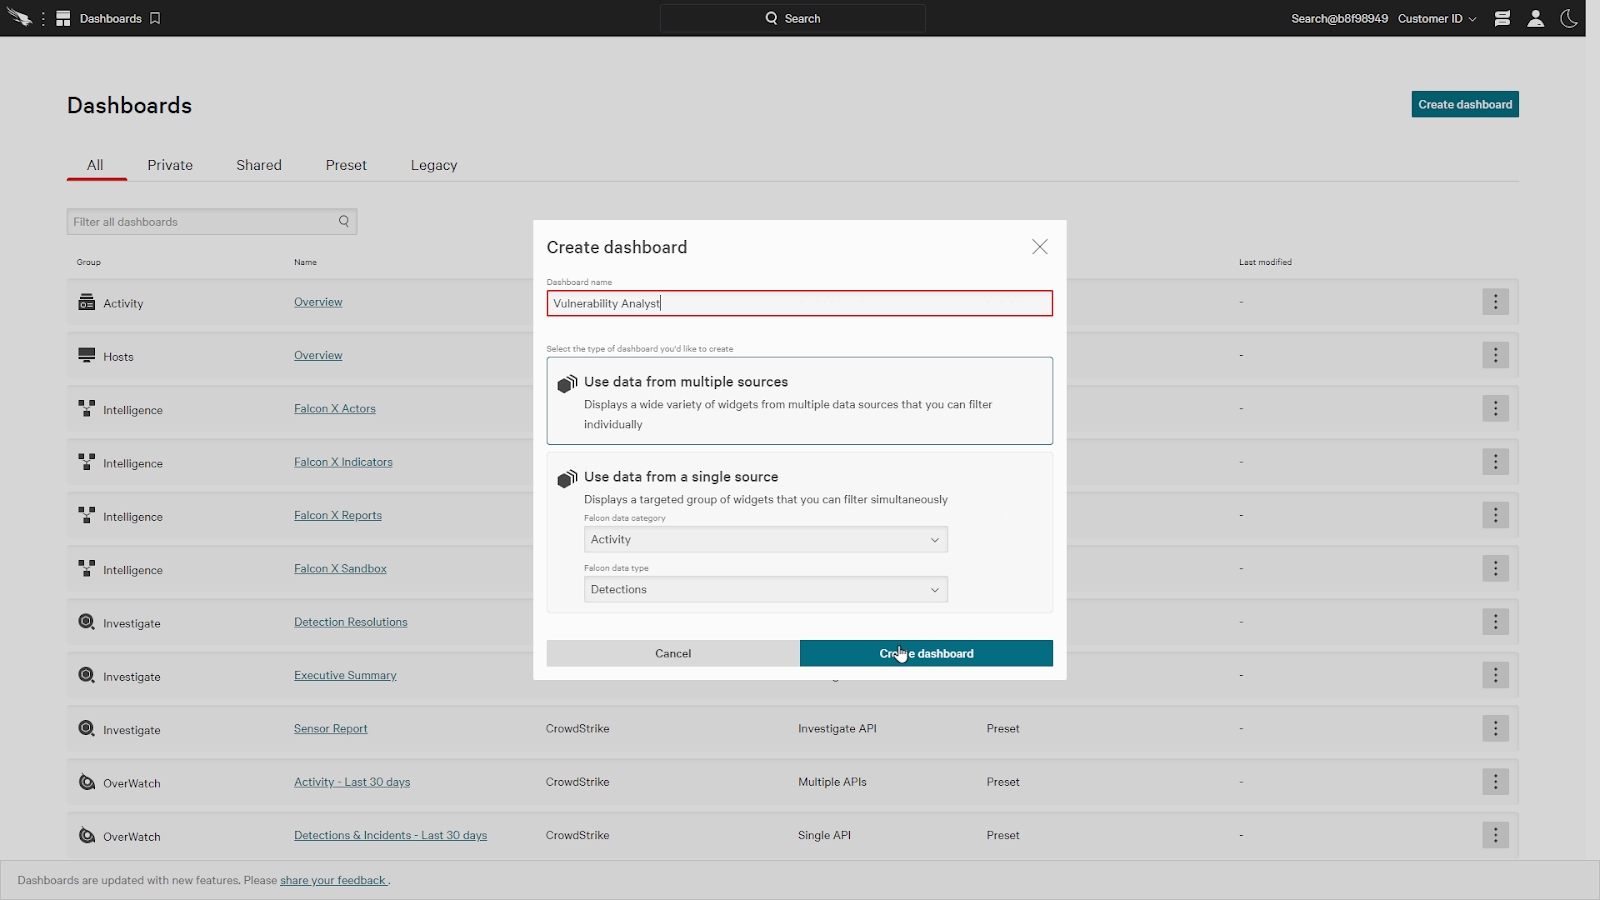
For our last example, let’s take a look at a dashboard to manage vulnerabilities.
We’ll create a new multi data source dashboard for a vulnerability analyst.
Next, we’ll add a few spotlight widgets, like the Hosts requiring reboots and recommended remediations.
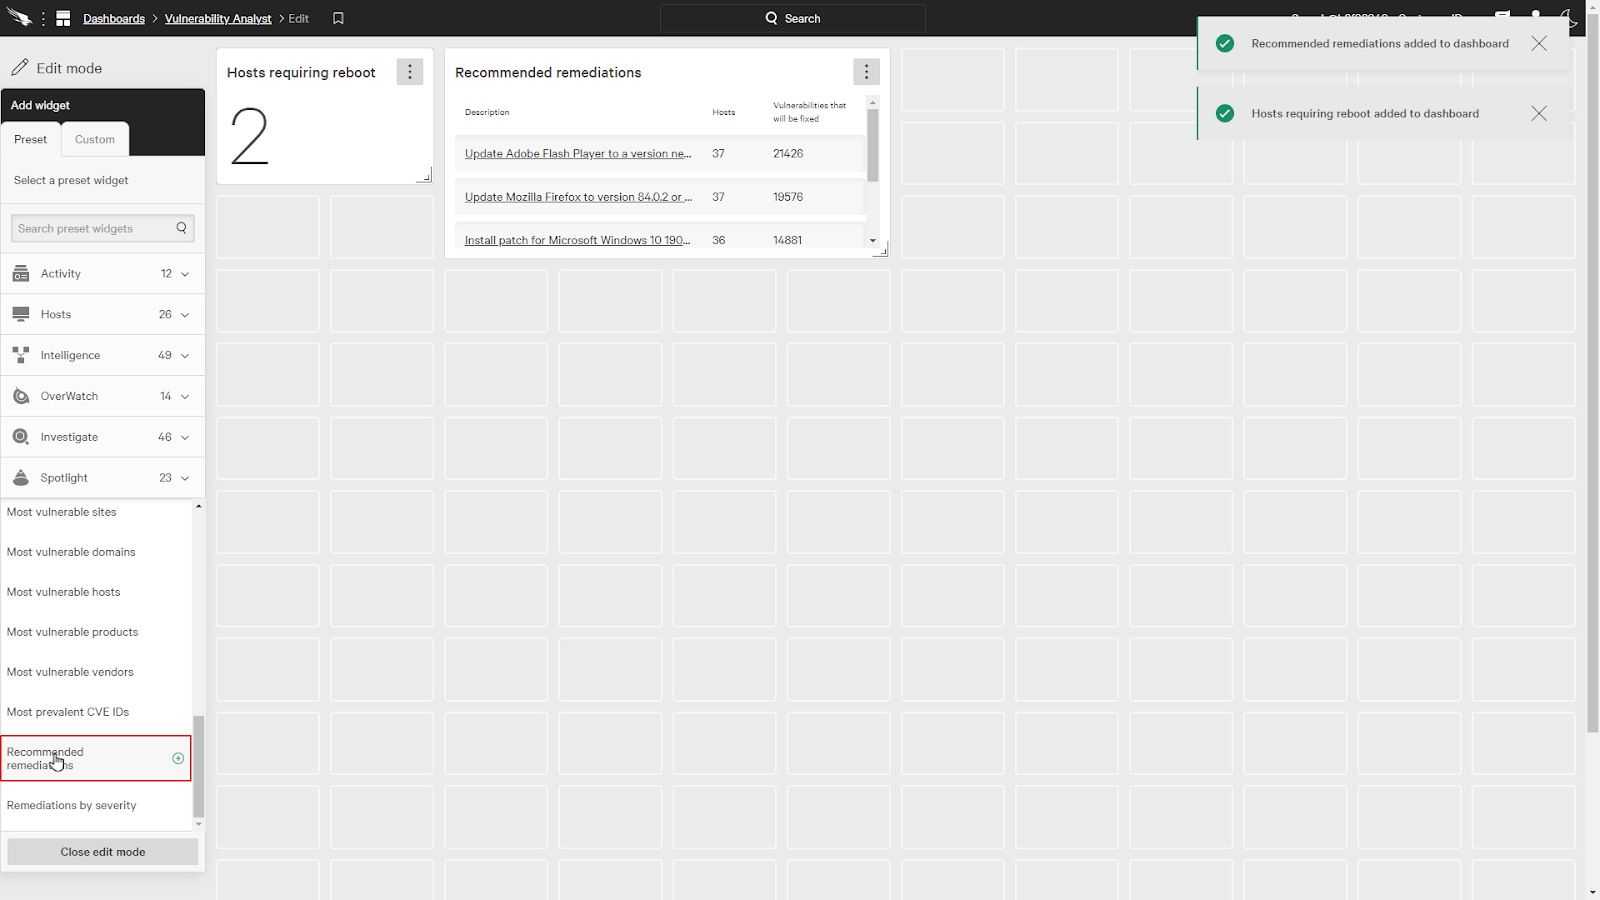
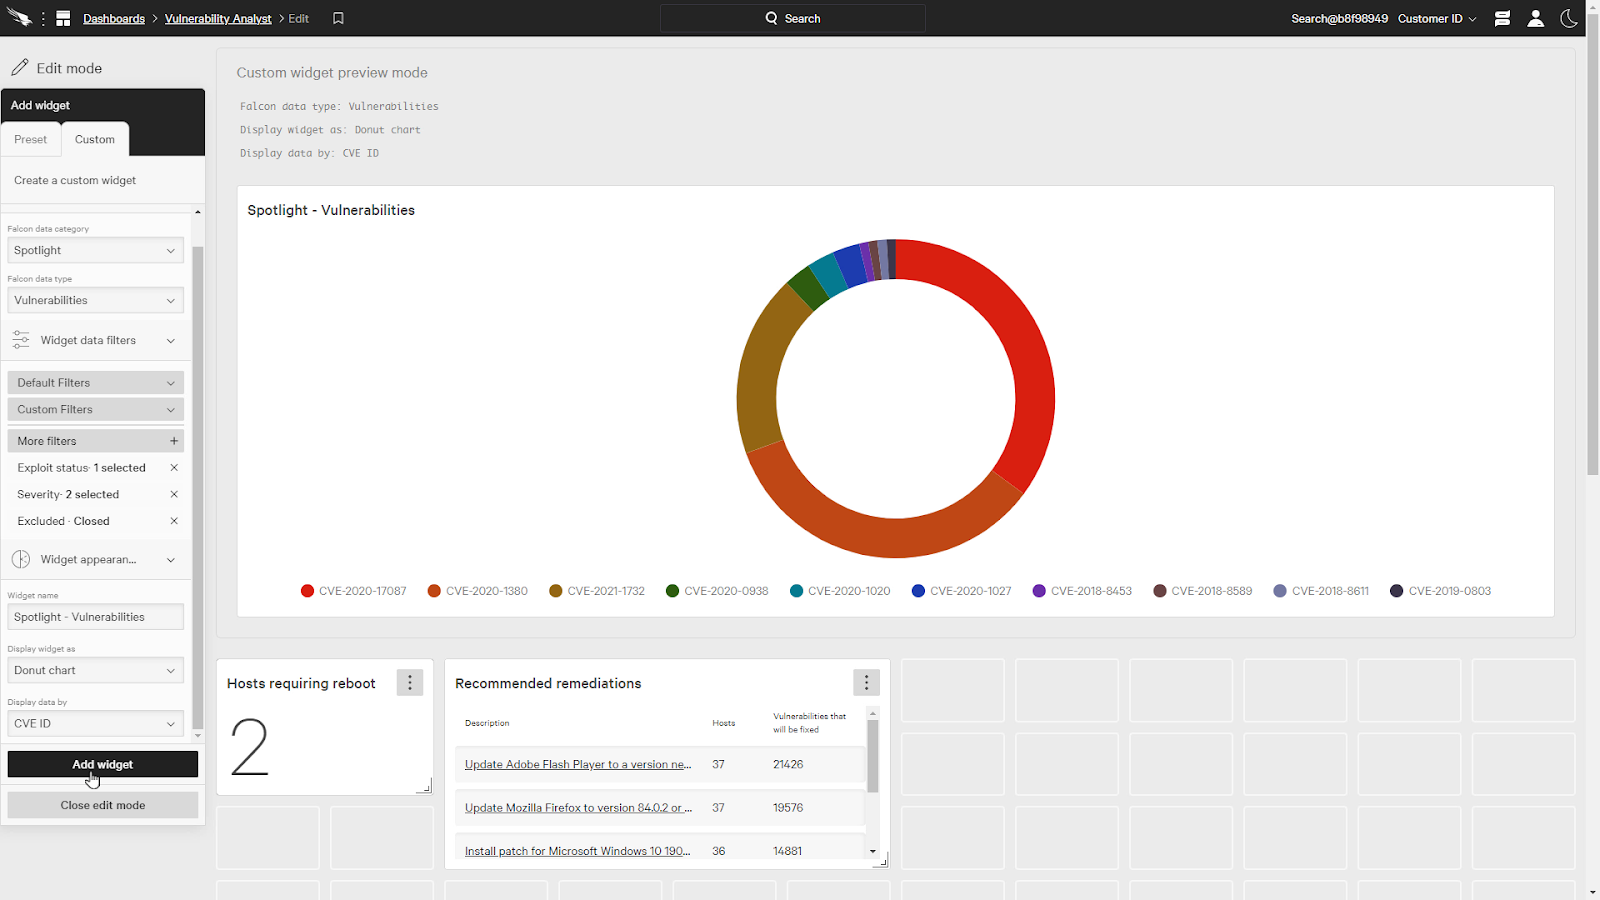
Now, under the custom tab, we’ll add a custom spotlight widget for vulnerabilities.
Even though this is a multi data source widget, we’re still able to add filters for an individual widget. We’ll keep the status filter and add exploit status and severity.
For exploit status, let’s select “Actively used” and for severity, let’s pick Critical and High.
We’ll also make it a donut chart and select the CVE ID as the data type.
With the dashboard complete, we can easily see the most prevalent vulnerabilities in the chart.
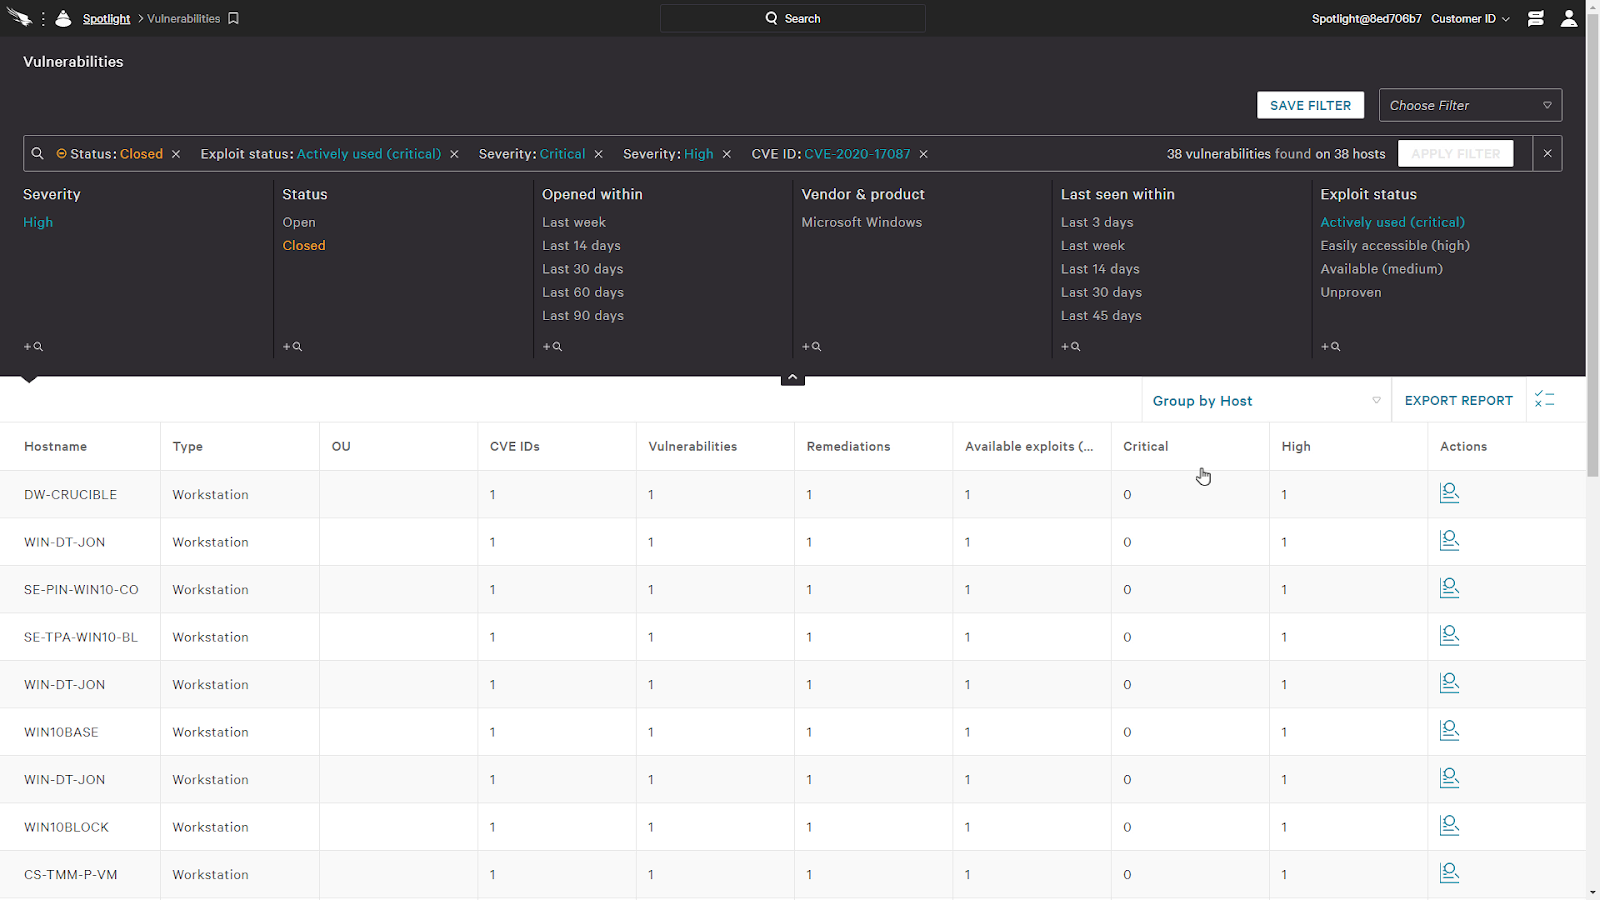
When we click on a donut slice, it’ll pivots us directly to a view of the vulnerability
In this view, we can see all the hosts impacted by selecting Group by hosts. By resolving this single vulnerability, we can resolve it on all these hosts.
Conclusion
As we can see, Crowdstrike’s ability to customize dashboards provide high fidelity views of data for specific roles on the security team. This allows them to cut through the noise and save time while working faster to remediate attacks.