- Falcon adds a new feature that uses Intel hardware capabilities to detect complex attack techniques that are notoriously hard to detect.
- CrowdStrike’s new Hardware Enhanced Exploit Detection feature delivers memory safety protections for a large number of customers on older PCs that lack modern in-built protections.
- Once activated, the new feature detects exploits by analyzing suspicious operations associated with exploit techniques, such as shellcode injection, return-oriented programming and others, strengthening CrowdStrike’s existing layered protection against sophisticated adversaries and threats throughout the attack chain.
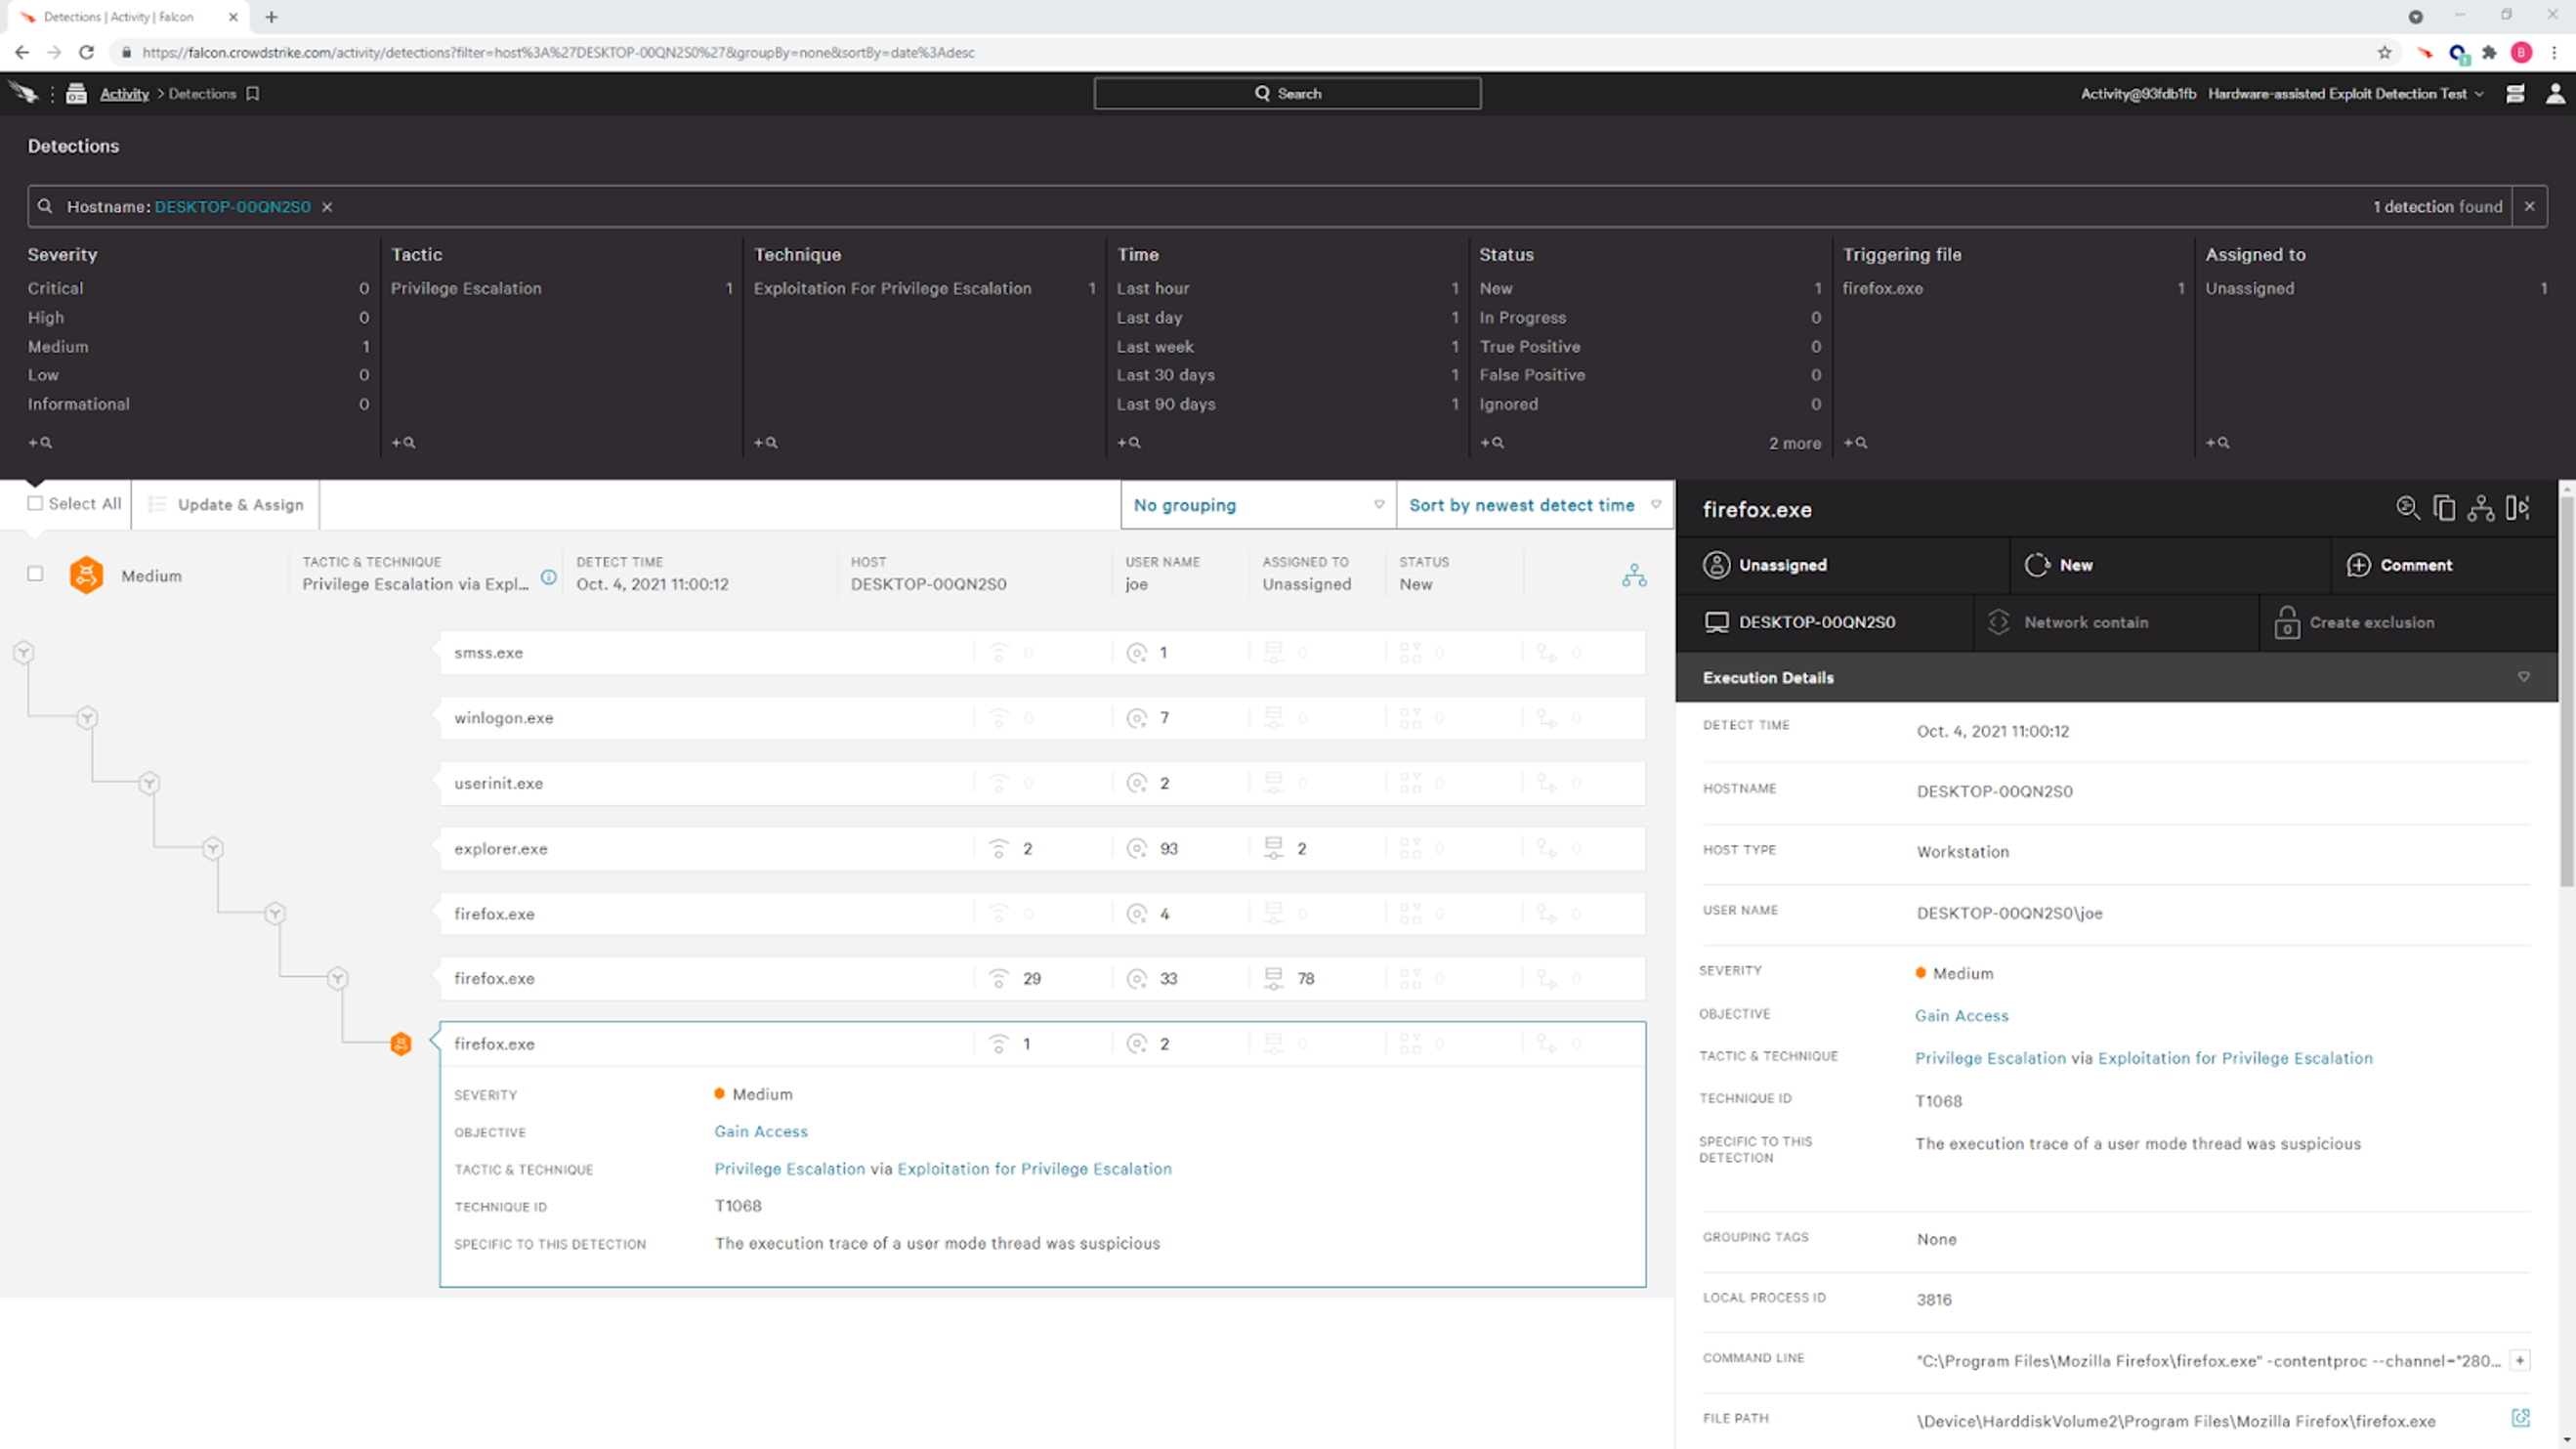
is enabled and supported by the machine, the Falcon sensor will enable execution tracing for a selected set of programs. Whenever the program executes a critical system service (like creating a new process), the sensor will analyze the captured trace to look for suspicious operations. This innovative approach to exploit detection is already proving valuable and has detected several return-oriented programming-based (ROP) exploit chains triggered by vulnerabilities such as CVE-2019-17026, which targets FireFox. To fully understand this feature, it’s important to first understand the attacker’s technique, which is often the first step in an attack chain leading to a breach. This chain involves a series of actions perpetrated by an adversary or malicious software and can include some or all of the following: initial access, execution, gaining persistence, privilege escalation, defense evasion, credential access, network discovery, lateral movement, collection, command and control, and exfiltration. The Falcon sensor provides visibility into many of these steps, using machine learning and artificial intelligence along with indicators of attack (IOAs) to correlate certain attacker behaviors to detections. This allows Falcon to interrupt the attack chain at multiple points to prevent further actions, before any damage is done. The earlier in the chain this can be achieved, the better.
Exploits to Gain Initial Access
One of the early mechanisms used by adversaries for initial access is exploiting vulnerabilities in software to achieve execution of malicious code. There are countless ways of achieving this, usually starting by making a vulnerable application or service process a maliciously crafted input, like a file or network packet, that triggers a bug, like a buffer overflow or use-after-free, which through one or more exploitation techniques eventually leads to code execution controlled by the attacker. Some of these techniques are shellcode injection, return-oriented programming, call-oriented programming, counterfeit object-oriented programming and jump-oriented programming.Shellcode Injection
This technique places the malicious code (aka “shell code”) into a stack or heap buffer and then uses a software bug to overwrite a function’s return address or a function pointer to point to the malicious code. As soon as the function returns, or the overwritten function pointer is used, the shell code is executed. Since the widespread introduction of Data Execution Prevention (DEP), which prevents the CPU from executing instructions on the stack and heap by marking it as non-executable (NX), this technique requires the attacker to first change the memory protection on the injected shell code to remove the NX protection. Therefore, it requires at least one more exploit technique to modify the memory protection. This has led to code-reuse attacks, which execute small pieces of code from the program itself or its libraries. The most well-known variant of these attack methods is return-oriented programming, or ROP.Return-oriented Programming (ROP)
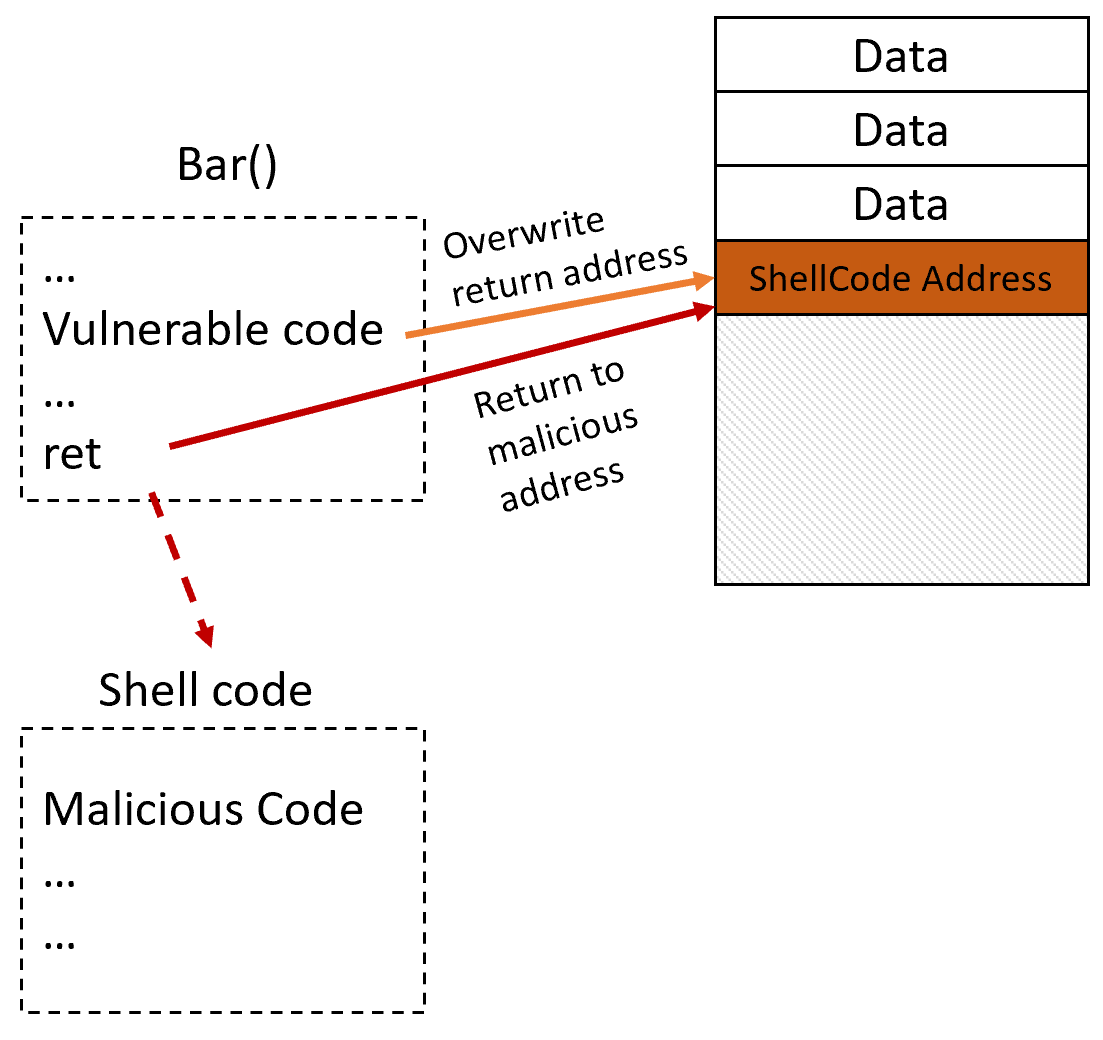
This technique bypasses DEP by getting rid of shellcodes entirely and reusing existing code from the executable or loaded DLLs. Instead of placing the malicious code directly into memory, a stack buffer is filled with the addresses of ROP “gadgets” — small pieces of code that consist of a few instructions followed by a return instruction. The attacker then abuses a software bug to overwrite a function’s return address to point to the first ROP gadget, which consists of instructions to adjust the stack pointer so that it points to the buffer containing the addresses of the following ROP gadgets, which can be on the stack or on the heap. Each gadget will execute a few instructions and then "return" to the next gadget address on the stack. By chaining appropriate ROP gadgets, an attacker can craft a chain of instructions that lead to the desired operation like bypassing DEP, loading a DLL or starting a new process. If the ROP chain is carefully crafted, it can even clean up the traces of the stack manipulation — like pivoting the stack pointer to a heap address — before executing the final operation, so that it becomes difficult to detect by just analyzing the call stack. For example, here’s a simple demonstration of ROP. Function Foo() calls function Bar(), pushing the return address on the stack. Function Bar() contains a vulnerability that allows an attacker to take control of the stack and overwrite the return address, placing the address of a malicious shellcode there instead. Once the function returns, the malicious return address is called and the shellcode executes: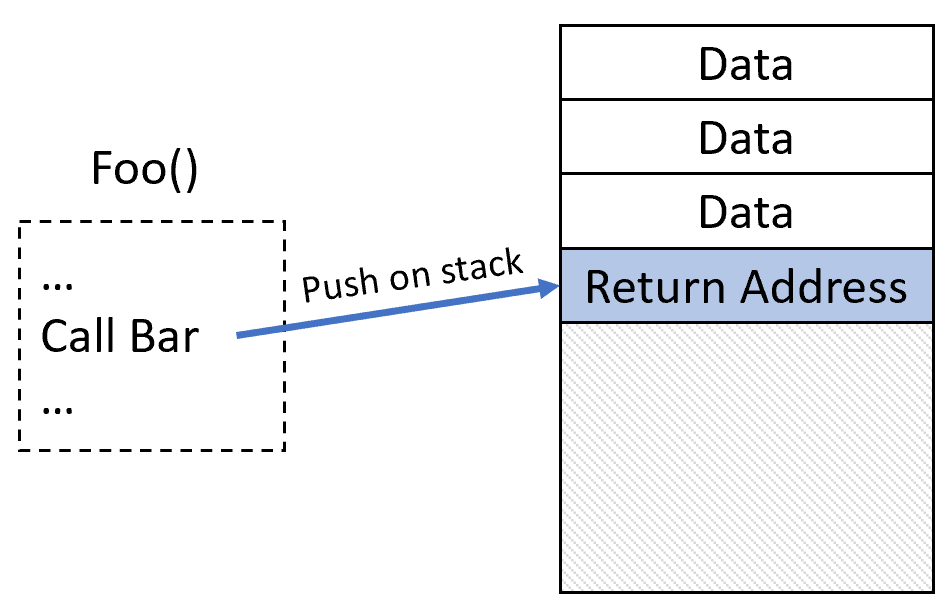
Other Code-reuse Attacks
There are a few other techniques that attackers can use instead of or in combination with ROP:- Call-oriented programming (COP): This technique is similar to ROP, but instead of overwriting the return address on the stack, it overwrites a function pointer. This can be useful to initialize an exploit, as it can be easier to leverage a buffer overflow to overwrite a function pointer on the stack or on the heap than to overwrite the return address on the stack without destroying the stack cookie.
- Counterfeit object-oriented programming (COOP): This technique uses a C++ object with virtual methods to redirect the flow of execution. Instead of modifying a function pointer directly, a v-table pointer in an object is overwritten.
- Jump-oriented programming (JOP): This technique uses an indirect jmp instruction in the software to redirect execution to an attacker-controlled location. Instead of chaining return addresses, JOP usually uses a table of addresses of JOP gadgets together with a so-called "dispatcher gadget": a small piece of code that increments a register value to point to the next address in the jump table and then does an indirect jump to that address. The JOP gadget in turn executes a few instructions and then does an indirect jump back to the dispatcher gadget.
Existing Countermeasures
Different mechanisms exist to prevent or detect these exploits, including stack cookies, control flow integrity, call stack analysis and Intel CET. Unfortunately, many of these approaches have limitations reducing their effectiveness, as we discuss next.Stack Cookies
A stack cookie is a value that is placed on the stack, between the local variables and the return address. The compiler will generate code that initializes the stack cookie on function entry by XORing a magic value with the current stack pointer, and subsequently checks the value before returning to the caller and crashes the process if the value doesn’t match the expected one. This mechanism is typically only added to functions that use stack buffers, which could suffer from a buffer overflow bug, preventing it from being abused to overwrite the return address.Control Flow Integrity (CFI)
Control flow integrity describes a family of mechanisms that attempt to protect indirect calls (e.g., from function pointers or virtual methods) from being manipulated. This is done by inserting compiler-generated code that validates that the target of an indirect call is a legitimate call target. On Windows, this protection mechanism is called Control Flow Guard (CFG). To validate the call target, a bitmap is used, which is generated by the kernel from metadata in the images of all loaded DLLs and executables and mapped into the address space of every process that supports it. Each bit represents 8 bytes of code, resulting in a huge bitmap. Unfortunately, CFG needs to be enabled with a compiler flag and it isn’t widely adopted yet. It cannot be enforced on DLLs that were compiled without CFG, and for processes that have it disabled, it’s automatically disabled for all system DLLs as well, even though they support it. Windows 11 has an improved mechanism called Extreme Flow Guard (XFG). Here the compiler inserts a 64-bit hash of the function signature before each function. For each indirect function call, the compiler generates instructions that load both the function pointer and the hash of the function to be called into registers followed by a call to a dispatch function that first validates whether the hash matches the one stored before the target function, before jumping to the target. The current implementation in the pre-release of Windows 11 is rather useless, though, because a hash mismatch (as well as an unaligned target address) simply leads to a fallback to bitmap-based CFG.Call Stack Analysis
While all previously described mitigations are implemented through the operating system, security software has its own ways of detecting such techniques. For example, security software can intercept certain system functions and analyze the call stack for signs of manipulation, like a stack frame outside of the actual stack or return addresses on the stack that do not match any call instructions. This is typically a sign of a ROP exploit. But more sophisticated exploits are able to restore the stack into a sane state before calling any system services, making it almost impossible to detect the exploitation just by looking at the stack, after the exploitation has taken place.Intel CET
Since “Tiger Lake,” Intel CPUs support a feature called Control-Flow Enforcement Technology (Intel CET). It provides two features to protect from code-reuse attacks: indirect branch tracking (IBT) and shadow stack (SS). IBT adds the ENDBR instruction, which marks legitimate targets of indirect calls and jumps, disallowing indirect jumps and calls to any other instruction. Shadow stack, which is inaccessible to user mode, automatically stores copies of return addresses from the normal stack and detects mismatches of the return value between the normal stack and shadow stack. It is supported by Windows 10 RS5.CrowdStrike’s Alternate Approach
While a number of viable solutions exist, they are either limited in their protection (stack cookies, stack analysis) or require support from the compiler and OS, and in the case of Intel CET, require a modern PC refresh. It can be expected that unprotected software will be around for many years to come. To address the issue now for existing software, an alternate approach is needed. To address this, we investigated the use of Intel Processor Trace to implement a software solution.Intel Processor Trace
Intel Processor Trace, or Intel PT, is a CPU feature present on Intel CPUs since the fifth generation ("Broadwell"). It allows the CPU to continuously write information about the currently executing code into a memory buffer, which can be used to reconstruct the exact control flow. The primary usage scenario is to trace an executable while it runs, store the trace on the disk and afterward analyze it to reproduce the exact sequence of instructions that has been executed. In this scenario, the analysis doesn't need to be extremely fast, but the capture of the trace still needs to be efficient to not excessively slow down the process’ execution. To achieve this, the CPU writes the trace using packets that are extremely optimized for size, resulting in an overhead of only a few percent. To minimize the amount of data to write, the CPU doesn't store any information that can be reproduced from the executable code, which is expected to be available for analysis. For example, the CPU will only write a packet when execution is going to a location that cannot be determined from the instruction being executed. This means execution of direct jumps and calls, which have target addresses hardcoded in the binary, will not cause a packet to be generated. Indirect calls and jumps, as well as returns, which cannot be derived from the executable code, will result in a packet that specifies the target address of the instruction. Another operation that results in packet generation is a conditional jump. For such a jump, the target is already encoded in the executable, so the only information needed is whether the branch was taken or not, which can be represented by a single bit. To achieve this, the CPU will write a packet type called Taken Not Taken (TNT) packets into the buffer, which will store multiple bits, each representing a single conditional jump. Another optimization is not writing the full target address of an indirect jump, but only the lowest bytes of the target address, since the top bytes usually remain the same. This usually reduces a packet from 9 bytes to 5 bytes or even 3.Configuration
Intel PT is configured using model-specific registers (MSRs). These registers exist per CPU core and thus affect tracing on a per-CPU basis. To capture the trace of an application, it is necessary to collect the trace on a per-thread level. To achieve this, the operating system needs to save and restore these MSRs on each thread-context switch. This is done by using the XSAVES and XRSTORS instructions, which allow the operating system kernel to save and restore different register sets. These are extended versions of older XSAVE and XRSTOR, which only allowed to save and restore generic user-mode available registers and could thus be executed in user mode. The S suffix in the new instructions indicates “Supervisor” mode (or kernel mode), allows to save and restore the privileged CPU state and can only be executed by the kernel. Starting from the sixth generation, Intel CPUs ("Skylake") can save and restore the Intel PT state MSRs with these instructions. Additionally, the OS needs to support this. Windows 10 implements this since RS4.Using Intel PT to Detect Exploitation
Being able to capture the execution trace of an application, security software that runs in the kernel now has the ability to look for code reuse attacks by parsing the captured trace packets together with the executed instructions in the address space of the application. Being able to decode the instructions relies on them still being present when the packets are being analyzed. This is almost always the case, when the number of analyzed instructions doesn't get too large. While it is generally desirable to keep the number of instructions in the buffer low to reduce the analysis cost, it also has to be large enough to fully cover larger library functions, like CreateProcess, which execute a large amount of instructions before switching to kernel mode, so that the exploit that led to the call to it is still in the buffer when the kernel mode service is finally called. In its analysis, security software can now check for different suspicious operations, like returns not matching calls, suspicious stack pointer loads, excessive use of indirect calls and jumps, and more.Falcon Hardware Enhanced Exploit Detection
With the release of version 6.27, the CrowdStrike Falcon® sensor has a new feature called Hardware Enhanced Exploit Detection, which leverages Intel PT in the way described above. If the feature is enabled and supported by the machine, the sensor will enable execution tracing for a selected set of programs. Whenever the program executes a critical system service (like creating a new process), the sensor will analyze the captured trace to look for suspicious operations. Due to the requirements mentioned above, the feature is only available on systems with Intel CPUs of the sixth generation or newer, running Windows 10 RS4 or later.Operation
For each process that is selected for trace analysis, each thread will be configured to enable tracing of all user mode code. A trace buffer is allocated for each thread (32 KB has been shown to be sufficient), and the MSRs are configured in the context of the thread. Windows will save and restore the configuration MSRs on each thread context switch, thus making sure the trace buffer will only contain the traces from this thread. Kernel mode callbacks with configurable pre-filtering decide when an analysis is due and then run the analyzer, again in the context of the thread that is performing the operation. The analyzer decodes the packets written in the trace buffer and decodes instructions as needed to reproduce the control flow. To efficiently decode the trace, the analyzer uses a custom PT packet decoder that is optimized for the required operations it needs to perform. Additionally, it uses a highly optimized instruction decoder, which is able to decode tens of millions of instructions per second. This allows the analyzer to decode and validate a trace buffer that is large enough to cover calls to functions like CreateProcess in a few milliseconds. A typical analysis processes around 130,000 instructions in around 5 milliseconds. Obviously, this is still an overhead that can result in slowdown of the application if done too often. Therefore, analysis needs to be triggered only rarely, like when a new process is created or a new dll is loaded. Pre-filtering based on the invoked system call and the parameters of the events helps reduce the number of analysis operations and configurable size of the analyzed buffer, and as a result, can reduce the analysis duration. One method of analysis is maintaining a "shadow stack," which records the addresses of call instructions and subsequently validates the targets of return instructions to match them.Whenever a call instruction is decoded, the analyzer will add an entry to the shadow stack, and whenever a ret is decoded, the analyzer will pop an entry from the shadow stack and compare it with the target IP that was captured in the trace buffer. Mismatches are recorded. Since the trace will start at an arbitrary location (e.g., from deep within a call chain), the shadow stack might not be built or might be already empty when a return is found. As a fallback, when no entries are present in the shadow stack — thus the legitimate return address is unknown to the analyzer — it checks whether the target address is after a call instruction. When an application is exploited using ROP and a system call was invoked as a result of a ROP chain, the execution trace would contain a number of returns that don’t match the recording from a shadow stack and in the majority of cases also don’t return to an address found immediately after a call instruction. Additional indicators of exploitation are sequences of short gadgets followed by a ret and unusual stack pointer-modifying operations. Whenever the analyzer encounters one of these, it is considered a potential ROP gadget. During the analysis, data is collected, and then evaluated afterward to decide whether a ROP attack is likely based on the data.
False Positive Mitigation
As already mentioned, the binary code that the trace has recorded executing is usually still in memory. There can be cases, though, when it is not. For example, JIT code might have been deallocated or overwritten after it was executed, but before the analysis happens. This can lead to being unable to follow the execution trace, or even misinterpretation of it. There are mitigations in the analyzer that will detect such scenarios and avoid accumulating false positives. Additionally, the analyzer collects telemetry data about decoding failures, allowing config to selectively disregard the results.Detection
As of Falcon sensor version 6.27, we have added a new detection (SuspiciousExecutionTrace) and a telemetry event (PtTelemetry) that accompanies it. Early analysis shows that this approach to exploit detection will prove fruitful as we have been able to demonstrate detection efficacy on a number of ROP-based exploit chains triggered by vulnerabilities such as CVE-2019-17026, which targets FireFox.Summary
In our mission to stop breaches, CrowdStrike strives to continually expand our suite of exploit detection and prevention capabilities. Many CPU features, such as Intel PT, are underutilized and can be efficiently leveraged to detect and prevent exploits, and we will continue to invest in these CPU technologies to bring innovative capabilities to the Falcon sensor. It is essential to mention that CrowdStrike Falcon® takes a layered approach to protecting customers against exploits and advanced threats by using machine learning (on sensor and in the cloud) and behavior-based detection using IOAs. Customers who run the Falcon sensor on virtual machines or other configurations that do not support Falcon Hardware-Enhanced Exploit Detection are still fully protected by Falcon's layered approach to securing customer environments.Additional Resources
- Visit the product website to learn how the powerful CrowdStrike Falcon® platform provides comprehensive protection across your organization, workers, data and identities.
- Get a full-featured free trial of CrowdStrike Falcon® Prevent™ and learn how true next-gen AV performs against today’s most sophisticated threats.


![Helping Non-Security Stakeholders Understand ATT&CK in 10 Minutes or Less [VIDEO]](https://assets.crowdstrike.com/is/image/crowdstrikeinc/video-ATTCK2-1)
![Qatar’s Commercial Bank Chooses CrowdStrike Falcon®: A Partnership Based on Trust [VIDEO]](https://assets.crowdstrike.com/is/image/crowdstrikeinc/Edward-Gonam-Qatar-Blog2-1)


